Learning SQL Wait Stats: The Complete Series Guide

Learning SQL Wait Stats is the fastest way I know to find out why a SQL Server is slow. This page lists every post in my wait stats series, in reading order. Keep it open in a tab and come back to it as you go.

Casey, Ace and Quinn face a busy night at the Clipboard Diner while a gray shadow falls across the floor, and Casey's clipboard unrolls into a list that runs right out the door. Casey says, "One wait a night. Slow is a list we can read."

One Story, 28 Nights

The series is told as one story. The Clipboard Diner sits at mile marker 28 on a two-lane highway, and it never closes. Its owner, Casey, gets a postcard: the food critic from the county paper will visit in 28 nights. The food is good, but the plates are always late.

So Casey picks up a clipboard and asks a better question: What are we waiting for? Each night Casey finds one kind of waiting in the kitchen. Each post then shows the same wait inside SQL Server. You get a query to see it and the fixes in order.

The cooks are worker threads, the burners are CPU schedulers, and the basement cooler is the disk. Pat’s order book is the transaction log, and Quinn, who carries the plates, is your application. You’ll meet all of them on the opening night.

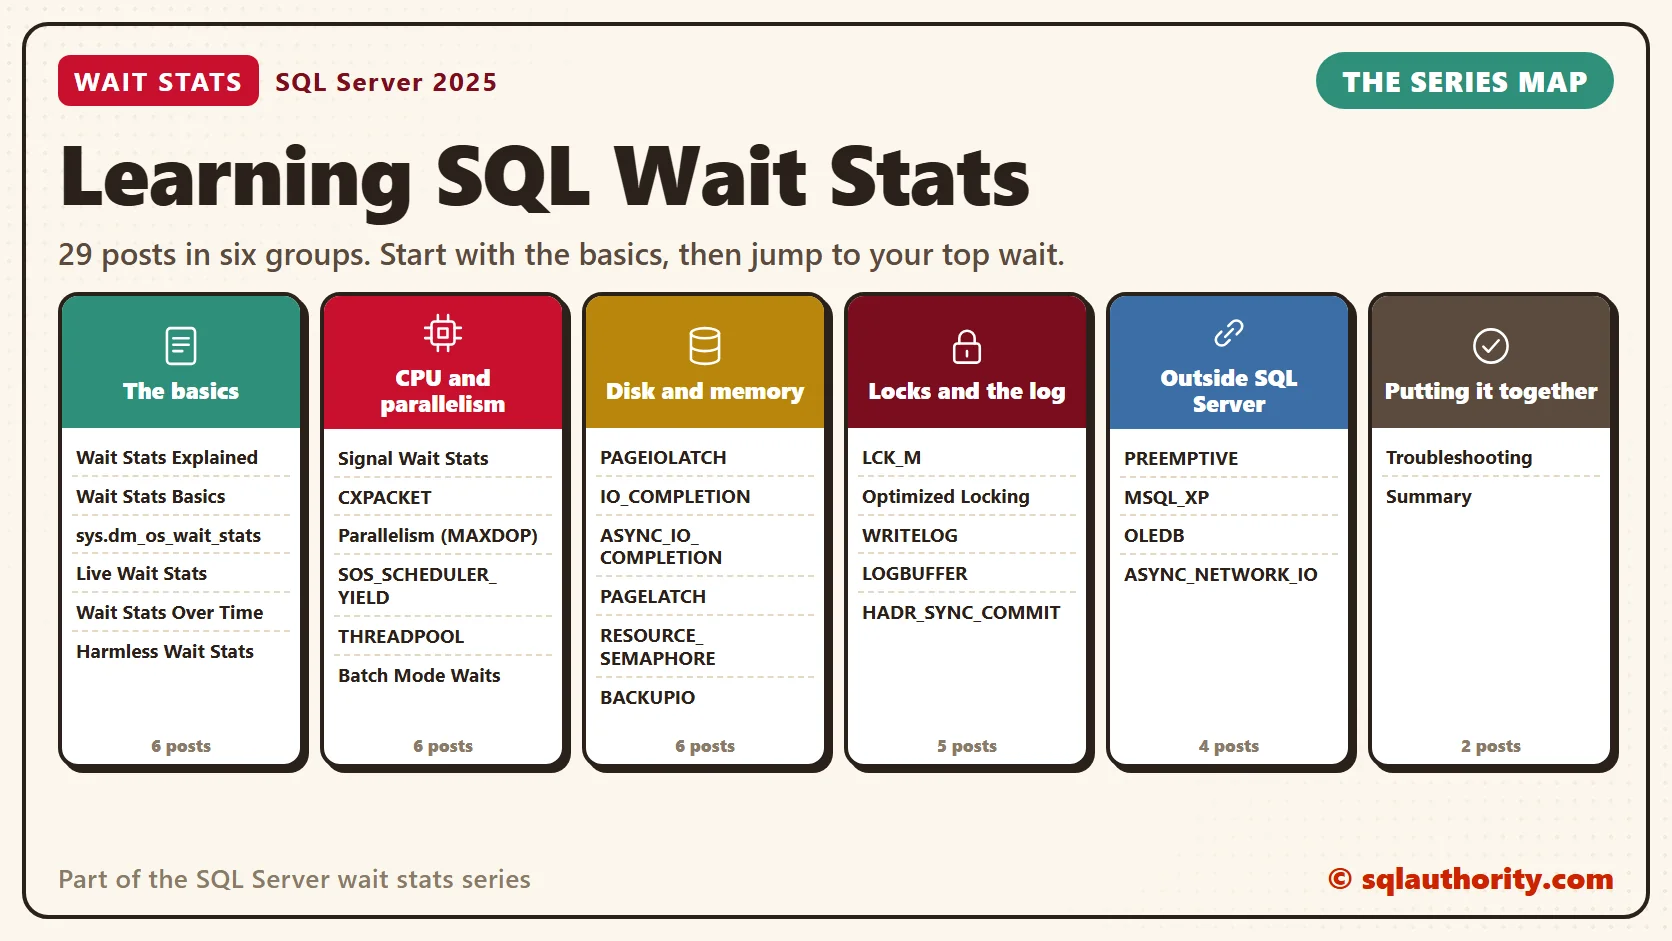
Every Post in the Series
NightWait stats lessonThe night at the diner
0Wait Stats Explained: SQL Server as an All-Night DinerThe postcard from the critic
1Wait Stats Basics: How Waits Work in SQL ServerCasey follows one Garden Hash with a stopwatch
2Signal Wait Stats: CPU Waits vs Resource WaitsThe potatoes arrive, but every burner is busy
3sys.dm_os_wait_stats: Reading the Wait Stats ListCasey reads the clipboard at 2 AM
4Live Wait Stats: What Is Waiting Right NowCasey walks the kitchen during the Saturday rush
5Wait Stats Over Time: Measuring One Time WindowTwo photos of the clipboard, one hour apart
6CXPACKET Wait Stats: What Parallel Waits MeanThe Monday tour bus and one slow plate
7Parallelism Wait Stats: Tuning MAXDOP and Cost ThresholdHouse rules for big parties
8SOS_SCHEDULER_YIELD Wait Stats: Reading CPU PressureEvery cook takes turns at the burner
9PAGEIOLATCH Wait Stats: Waiting for Data From DiskRunning to the basement cooler
10IO_COMPLETION Wait Stats: Spills, Sorts and File GrowthA sheet cake too big for the counter
11ASYNC_IO_COMPLETION Wait Stats: Large File OperationsThe night truck and a brand new shelf
12PAGELATCH Wait Stats: Hot Pages in Memory and tempdbEveryone writes on the same last line
13Harmless Wait Stats: Waits You Can Safely IgnoreThe night baker sleeps until 4 AM
14BACKUPIO Wait Stats: Why Backups WaitThe night truck waits for crates
15LCK_M Wait Stats: Lock Waits and BlockingThe party in booth 7 won’t leave
16THREADPOOL Wait Stats: When Worker Threads Run OutNobody is free to take an order
17WRITELOG Wait Stats: Transaction Log Flush WaitsPat’s pen slows down
18LOGBUFFER Wait Stats: When the Log Buffer FillsPat’s notepad fills up
19PREEMPTIVE Wait Stats: Calls Outside SQL ServerKit picks up the wall phone
20MSQL_XP Wait Stats: Extended Procedures and External CodeA caterer moves into the kitchen
21ASYNC_NETWORK_IO Wait Stats: When the Application Is SlowPlates go cold under the lamp
22HADR_SYNC_COMMIT Wait Stats: Availability Group CommitsThe sister diner across town
23OLEDB Wait Stats: Linked Servers and Remote CallsPie from the bakery across the street
24Optimized Locking Wait Stats: New Lock Waits in SQL Server 2025A new rule from the state
25RESOURCE_SEMAPHORE Wait Stats: Memory Grant WaitsA wedding party claims the counter
26Batch Mode Wait Stats: HTBUILD and Columnstore WaitsSheet-pan night
27Wait Stats Troubleshooting: From Top Wait to First FixA chart on the fridge
28Wait Stats Summary: Every Wait on One PageThe critic comes on an ordinary Tuesday

Series map of Learning SQL Wait Stats: 29 posts in six groups. The basics; CPU and parallelism; disk and memory; locks and the log; outside SQL Server; putting it together, with every post name listed under its group

Questions Readers Ask

Is this still relevant to the latest SQL Server? Yes. I rewrote the whole series for SQL Server 2025. The meaning of a wait rarely changes between versions, so most of this stays true for a long time. Where SQL Server 2022 or 2025 changed something, each post says so in its own section.

Where do I start? New to waits? Read the opening night and the first five lessons in order, up to Wait Stats Over Time. They teach the three query states, the wait list, live waits and how to measure one busy hour.

My server is slow right now. Which post? Open Live Wait Stats to see what’s waiting this minute. Then use Wait Stats Troubleshooting for the one-page chart.

I already know my top wait. Then skip the story and find that wait in the table above. Every post stands on its own, and each one links to the posts before and after it.
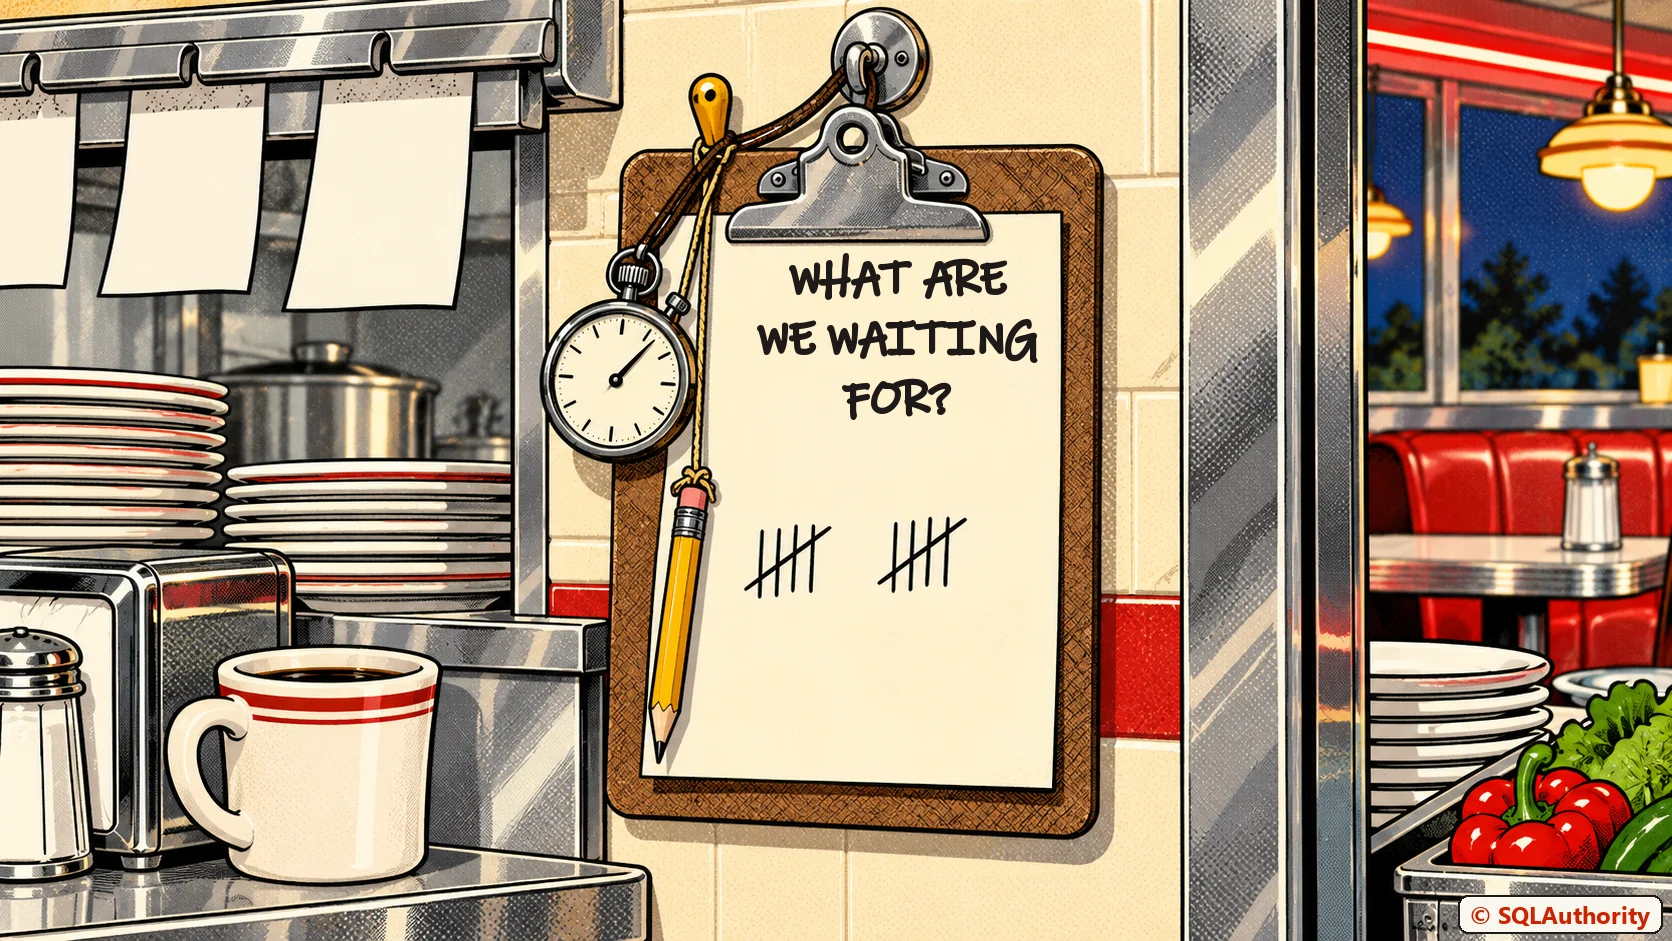
Casey's clipboard hanging by the kitchen pass with a stopwatch and a pencil on a string, and WHAT ARE WE WAITING FOR? written across the top of the paper

Do I need a monitoring tool? No. Every query that shows waits reads built-in system views and changes nothing. Fixes that change a setting are clearly marked. A good tool is nice to have, but it reads the same views. Knowing them helps you trust the tool, or catch it when a chart looks wrong.

Which versions and permissions? The queries run on SQL Server 2016 and later. When one needs a newer version, its post says so. On SQL Server 2022 and later, the wait queries need VIEW SERVER PERFORMANCE STATE. On older versions it’s VIEW SERVER STATE. The instant file initialization check reads a service view, so on 2022 and later it needs VIEW SERVER SECURITY STATE. Using Azure SQL Database? Start with my post on sys.dm_db_wait_stats.

How long will it take? Each post takes ten to fifteen minutes to read. One a day gets you through in four weeks, the same pace as Casey. Some readers finish it on a long weekend, and that works too.

One Thing Before You Start

I’ll argue against my own series for a moment. Wait stats won’t fix a slow server by themselves. They point, and you still have to do the fixing. But in my health checks, the slow servers I see were rarely short on effort. They were short on pointing at the right thing, and that’s what this series teaches.

A slow server is not a mystery, it is a list of waits you can learn to read.

Published by Pinal Dave on SQLAuthority. More of my work at pinaldave.com.


Discover more from SQL Authority with Pinal Dave

Subscribe to get the latest posts sent to your email.

SQL DMV, SQL Performance, SQL Wait Stats
Previous Post
Indexing JSON Properties With Computed Columns
Next Post
SQL SERVER – Performance Statistic Collection – Notes from the Field #018

Related Posts

Leave a Reply

Your email address will not be published. Required fields are marked *

Fill out this field
Fill out this field
Please enter a valid email address.