
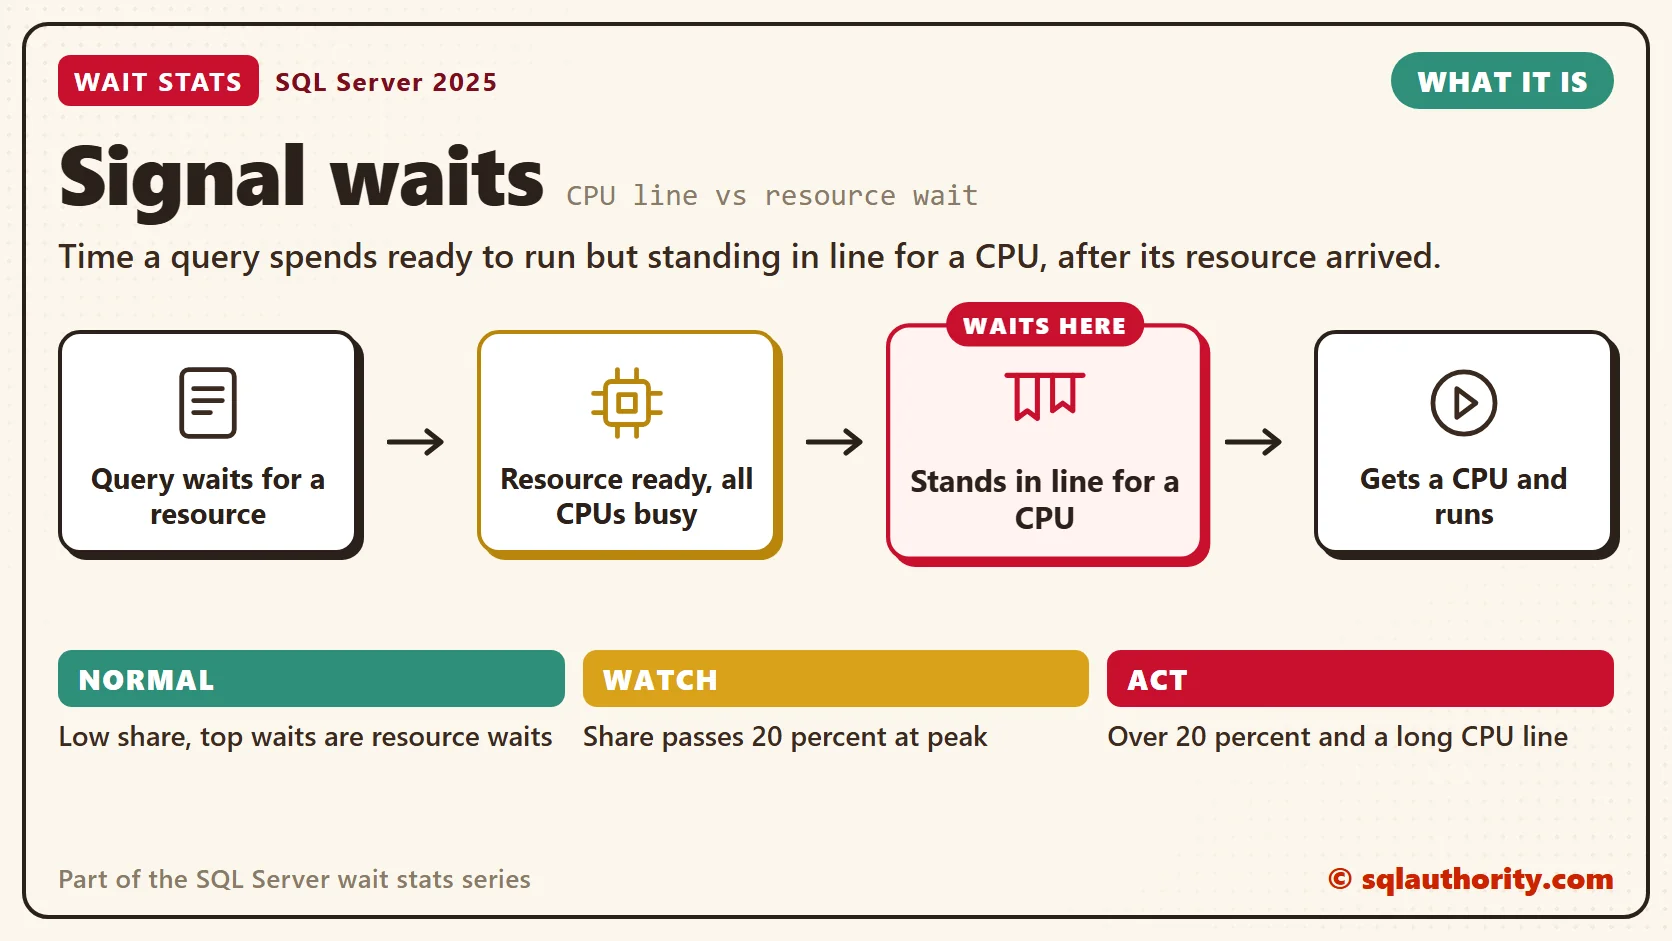
Signal wait stats measure the time a query spends ready to run but standing in line for a CPU. The rest of each wait is the resource wait: time spent waiting for a page, a lock or memory. Split the two, and you learn whether your server is short on CPU or short on something else.

This post is part of my wait stats series, told as one story at the Clipboard Diner. Every post is listed in the series guide.
Night 2 at the Clipboard Diner
After last night’s hash, Casey made one new rule. The dishwasher would bring potatoes up from the basement the moment the counter bin ran low. Nobody would have to ask. Casey was proud of that rule for almost two hours.
At 7:40 PM a trucker in booth 3 ordered the same Garden Hash. Kit took the ticket to a burner and reached for the potatoes. The bin was empty again, so Kit stepped away from the burner to wait. This time the dishwasher was already on the stairs. A fresh sack landed on the counter at 7:42, and Casey grinned at the stopwatch.
Then nothing happened. Kit had the potatoes, the peppers, the onions and a clean pan. The ticket had everything it needed, but all four burners were taken. Ace was flipping pancakes for a softball team. Jesse and Jules were working two stuffed peppers, and a fill-in cook from the roster had the last burner.
So the ticket went back on the rail and hung there for four minutes. Nothing was missing except a turn at the fire. Casey hung a second stopwatch beside the rail. From now on, the spike and the rail would be timed apart. Casey wrote on the clipboard: Potatoes: 2 minutes. Rail: 4. Two different problems.
What a Signal Wait Means
That’s what SQL Server does when a request gets its resource while every CPU is busy. The wait isn’t over yet. It has moved from the spike to the rail.
Here’s the full path. A running request asks for something it doesn’t have, such as a data page or a lock. It leaves the CPU and becomes suspended, so another task can use that CPU. When the page lands in memory or the lock is granted, SQL Server signals the request. It becomes runnable and joins the line for a CPU. When its turn comes, it runs again.
sys.dm_os_wait_stats keeps both pieces for every wait type. The wait_time_ms column is the whole wait, from the moment the request stopped until it ran again. The signal_wait_time_ms column is only the time in the CPU line. Subtract one from the other, and you get the resource wait.
Every wait type has a signal part, because every wait ends with a trip through the line. So a signal wait isn’t a wait type of its own. It’s the CPU line’s share of all the others.
Some waits are mostly signal time. SOS_SCHEDULER_YIELD is the clearest example. A query that uses up its short turn on the CPU steps back and goes straight into the line. The SOS_SCHEDULER_YIELD Wait Stats post covers that wait.
A Clue, Not a Verdict
Add up all the signal time and divide it by all the wait time. That gives you the share of waiting that happened in the CPU line. In my health checks, I look closer when signal waits pass 20 percent of total waits during the busy hour.
A high share alone doesn’t prove the server needs more CPUs. Many tiny waits each add a sliver of signal time, and slivers add up on a busy system. A Windows power plan that slows the processors raises the share too. So does a virtual machine whose host is short on real CPU.
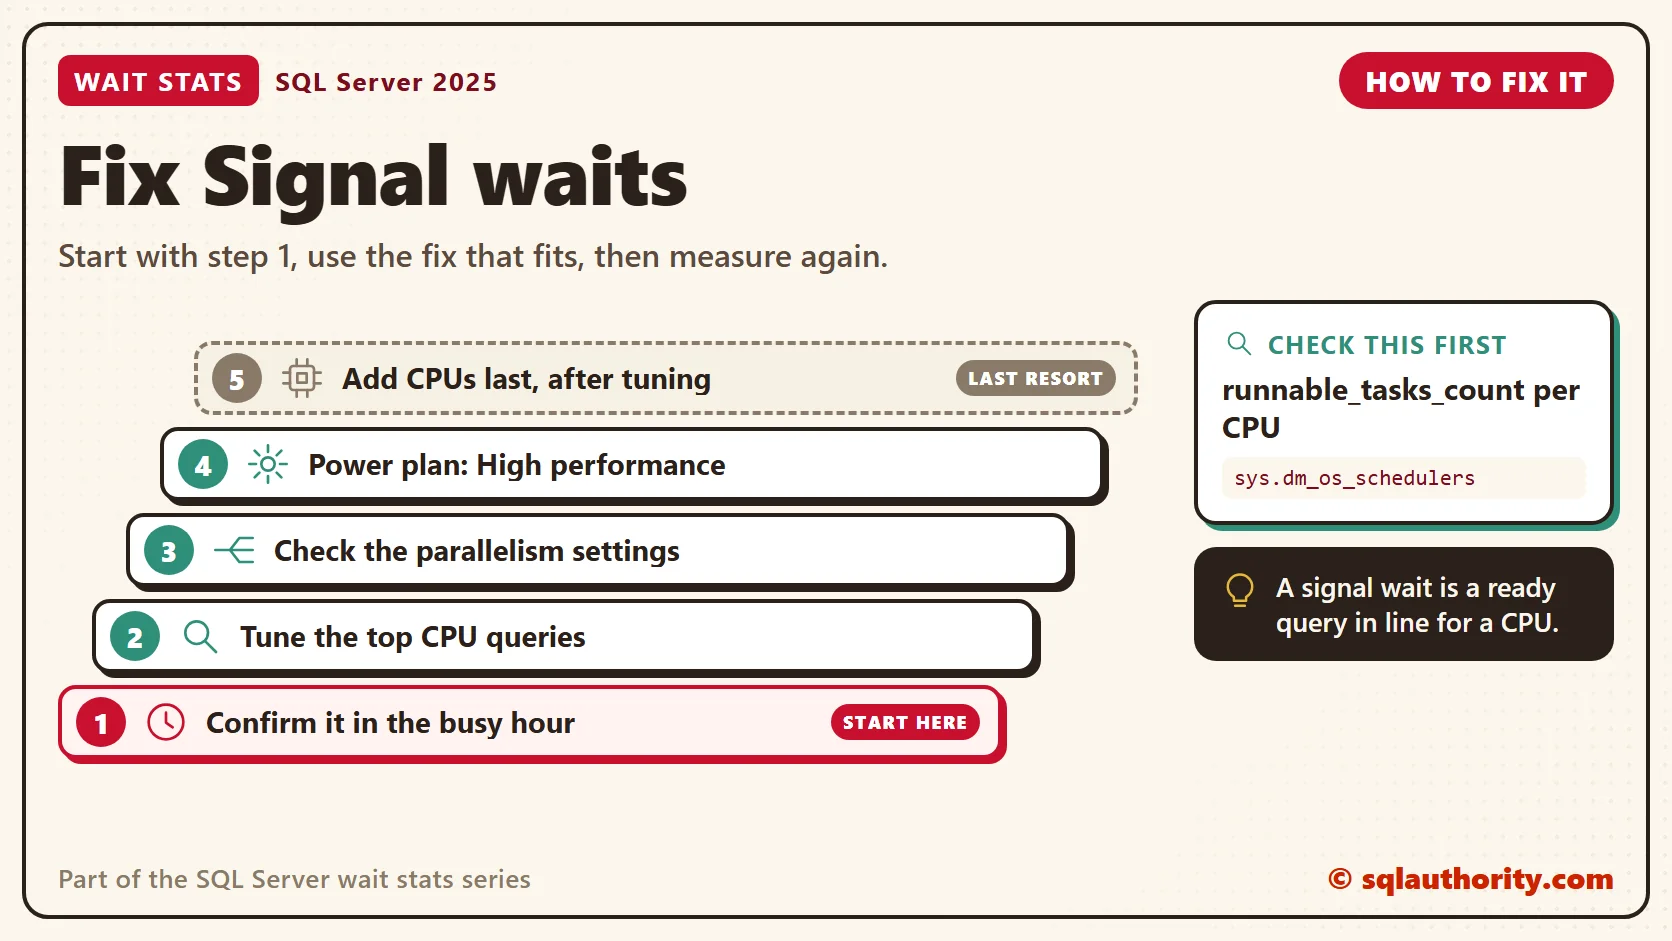
So I always check the line itself. sys.dm_os_schedulers has a runnable_tasks_count column for each CPU scheduler. That’s the number of tickets on the rail right now. A high signal share plus a line that stays long during the rush is CPU pressure. A high share with an empty line means the pressure came at another hour.
You could say a busy server should keep its CPUs full. That’s fair, because busy CPUs are money well spent. The problem is the line in front of them. Every request in that line is ready to go and still not moving.
The usual trap is to see a high signal share and add cores right away. The new cores can be full within weeks. One report query that scans a big table every minute is enough to do it. Tuning that query does more than new hardware.
Normal or a Problem?
| Situation | What it means | What to do |
|---|---|---|
| Signal share is low and the top waits are resource waits | CPU isn’t the line. Something else is slow. | Read the post for your top resource wait. |
| Signal share passes 20 percent in the busy hour, and runnable_tasks_count stays above zero | Requests wait in line for CPU. That’s CPU pressure. | Find the queries that burn the most CPU (see SOS_SCHEDULER_YIELD Wait Stats). |
| Signal share is high, but the line is empty when you look | The pressure happened at another time, or in short bursts. | Measure the busy window itself (see Wait Stats Over Time). |
| SOS_SCHEDULER_YIELD sits near the top, mostly signal time | Queries keep using full turns on the CPU. | Read SOS_SCHEDULER_YIELD Wait Stats and look at the heaviest queries. |
See It on Your Server
The first block gives the split for the whole server. Then it lists the waits with the most time in the CPU line. The numbers cover everything since the last restart, including background tasks that sleep on purpose. Those sleepers pad the total, so the share reads low. The harmless list in the sys.dm_os_wait_stats post removes them.
-- How much of all waiting was spent in line for a CPU?
SELECT CAST(SUM(wait_time_ms) / 1000.0 AS decimal(18, 1)) AS waited_sec,
       CAST(SUM(signal_wait_time_ms) / 1000.0 AS decimal(18, 1)) AS cpu_line_sec,
       CAST(100.0 * SUM(signal_wait_time_ms)
            / NULLIF(SUM(wait_time_ms), 0) AS decimal(5, 1)) AS signal_pct
FROM sys.dm_os_wait_stats;

-- Which waits spent the most time in line for a CPU?
SELECT TOP (10)
       wait_type,
       signal_wait_time_ms AS cpu_line_ms,
       wait_time_ms - signal_wait_time_ms AS resource_part_ms,
       CAST(100.0 * signal_wait_time_ms
            / NULLIF(wait_time_ms, 0) AS decimal(5, 1)) AS signal_pct
FROM sys.dm_os_wait_stats
WHERE signal_wait_time_ms > 0
ORDER BY cpu_line_ms DESC;
Look at signal_pct in the first result. In the second result, check whether one wait type owns most of the signal time. The mix alone can’t measure the line, though. Check it against the scheduler query below, run during the same busy hour.
The second query shows the line right now, one row per CPU scheduler. Run it several times during your busy hour, not once.
-- Tasks waiting in line for each CPU right now
SELECT scheduler_id,
       current_tasks_count,
       runnable_tasks_count,
       current_workers_count,
       active_workers_count,
       work_queue_count
FROM sys.dm_os_schedulers
WHERE status = N'VISIBLE ONLINE'
ORDER BY runnable_tasks_count DESC;
A zero in runnable_tasks_count with a brief bump now and then is healthy. Rows that stay above zero across many runs are your long rail. A value above zero in work_queue_count means tasks are waiting for a free worker thread. That’s a different problem (see THREADPOOL Wait Stats).
Fix It
When the signal share and the line both say CPU pressure, this is the order I work in.
- Confirm it. Run the scheduler query many times in the busy hour, and measure that hour on its own (Wait Stats Over Time).
- Find the queries that use the most CPU time and tune the top few. A missing index or a needless scan is the usual cause.
- Check the parallelism settings. Too many threads per query crowd the line (see Parallelism Wait Stats).
- Set the Windows power plan to High performance. On a virtual machine, ask whether the host gives you the CPUs it promises.
- Add CPUs last, after the heavy queries are fixed. Remember that more cores can raise your SQL Server license cost.
New in SQL Server 2022 and 2025
Nothing changed in how signal waits are counted. The math on SQL Server 2025 is the same as always.
What changed is how many threads compete for the CPUs. SQL Server 2022 added DOP feedback as an option, and SQL Server 2025 turns it on by default. It lowers the degree of parallelism for repeating parallel queries that waste threads. It needs Query Store in read-write mode and compatibility level 160 or higher. It’s an Enterprise feature, so Standard and Express don’t get it. Fewer wasted threads means fewer tickets on the rail. Parallelism Wait Stats covers it in full.
Related Reading
The Clipboard Diner, a wait stats series. Previous: Wait Stats Basics: How Waits Work in SQL Server. Next: sys.dm_os_wait_stats: Reading the Wait Stats List. Every post is listed in the series guide.
By 2 AM on the next night, the clipboard is getting long, and Casey finally sits down to read it.
A signal wait is not a slow resource, it is a ready query standing in line for a CPU.
Published by Pinal Dave on SQLAuthority. More of my work at pinaldave.com.
Discover more from SQL Authority with Pinal Dave
Subscribe to get the latest posts sent to your email.


13 Comments. Leave new
Great article, Pinal!
Think about it this way: a database system is much more complex than the SQL Server by itself. The reason being is that there are other components involved in “the big picture”.
Wat I am trying to say is that the internal waits, which are the topic of this article, are just a small part of the game, since the database system depends on the client system, networking, error handling, and so on. In other words, if you have a client application which sends adhoc queries of 80kb each 100 times per minute (trust me, I have seen this), then you will depend on the network, NIC configuration, internal SQL parsing, processing, plan generation, query execution, and if the dataset returned is large, then you will also depend on the NIC and the network.
Unfortunately, SQL Server is not too aware of other wait stats, aside from its own internal ones. (well, there are some network async IO stats, but it does not say who know how much about the cause of the problem)
The bottom line: when we talk about waits, keep in mind the “big picture”.
Hi Pinal,
Excellent analogy! Though if it were me, I might have waited for a cab that did accept credit cards :) Makes sense that lower single wait stats would be better for the system.
Hi Pinal,
Excelent analogy. Thanks for expaining this complex topic.
Rama
Hi friends
Mr. Pinal Dave wait stats articles very useful for me, it really great.
I executed on of my production server it looks like somewhat good in CPU waits stats, and resource waits is very high.
Please tell me how to reduce resource wait time on server.
%signal (cpu) waits – 22.25
%resource waits – 77.75
Thanks
ananda
Amazing Analogy.
Hi,
Im an sql amateur and was just wondering where do i find or how do i create this sys.dm_os_wait_stats table, cause if i run this, it tells me procedure does not exist.
Thank u in advance
Hi Pinal!
I just started using your query recently to monitor CPU pressure. After seeing what looked like spikes in signal wait time, I added some more detail to your query to show the magnitude of the percentages shown in the query. After seeing this data, I realized that what appeared to be spikes in signal wait time could be ignored.
Note, I have been collecting wait stats data hourly on all SQL Servers and then reporting the CPU pressure once per day for successive samples over the last 24 hours.
SUM(s2.signal_wait_time_ms – s1.signal_wait_time_ms) as signal_wait_time_ms_diff
, SUM((s2.wait_time_ms – s1.wait_time_ms) – (s2.signal_wait_time_ms – s1.signal_wait_time_ms)) as resource_wait_time_ms_diff
Nice write Pinal, thanks.
Now my wait_type is Async_Network_Io and it is in suspended state. Any idea what shuld be the quick resolution? even after clearing the proc cache? Thanks
In a perfect world, we wouldn’t need to wait for anything, but the world isn’t perfect and as long as we can plan for waits, then we can hopefully ensure consistent throughput.
Dave, an excellent write-up and thank you
Excellent, thanks :)
Excellent, thanks :)
Hi Pinal,
You are saying that “lower is better and higher is not good for the system.”
what we do if we get higher value which indicate CPU pressure, How to take control over it ?
Thanks
Analogy was excellent and amazing. With this, can understand the complex topic very easily