
Wait stats basics start with one simple idea: a query in SQL Server is always either working or waiting. SQL Server writes down every wait, by type and by time. Read that list, and it tells you where your server’s time goes.

This post is part of my wait stats series, told as one story at the Clipboard Diner. Every post is listed in the series guide.
Night 1 at the Clipboard Diner
The first night after the critic’s postcard, Casey didn’t fix anything. Casey watched. At 6:40 PM a trucker ordered the Garden Hash: potatoes, peppers and onions. Casey clicked the stopwatch the moment the ticket hit the rail.
The ticket hung there for two minutes. All four burners were busy, so it waited its turn. Then Ace grabbed it, reached for the potatoes, and stopped. The potato bin on the prep counter was empty. The ticket went on the spike to wait while the dishwasher ran down to the basement cooler.
Six minutes later a fresh sack of potatoes came up the stairs. By then the burners were full again, so the ticket went back on the rail for one more minute. Ace finally cooked it. The hash needed four minutes of cooking. It reached the table thirteen minutes after the order.
Casey looked at the stopwatch for a long time. Then Casey picked up the new clipboard and wrote the first line of the month: Cooking: 4 minutes. Waiting: 9. Nobody in the kitchen had been lazy. Every one of those nine minutes had a reason, and none of them showed up on the bill.
Running, Runnable and Suspended
That plate of hash is every query on your server. While a request works, each of its tasks moves between three main states. A parallel request has several tasks, so some can run while others wait. Learn these three words and the rest of this series gets easier.
Running means the request is on a CPU right now. That’s Ace at the burner. SQL Server gives each logical CPU a scheduler, and only one task runs on a scheduler at a time.
Suspended means the request needs something it doesn’t have yet. It can need a data page from disk, a lock another session holds, a memory grant, or a log write. That’s the ticket on the spike while the potatoes come up. SQL Server records this as a resource wait, and it names the wait type, such as PAGEIOLATCH_SH or LCK_M_X.
Runnable means the resource has arrived, and the request is ready to go. It’s waiting in line for a CPU. That’s the ticket back on the rail with its potatoes. SQL Server calls this time the signal wait.
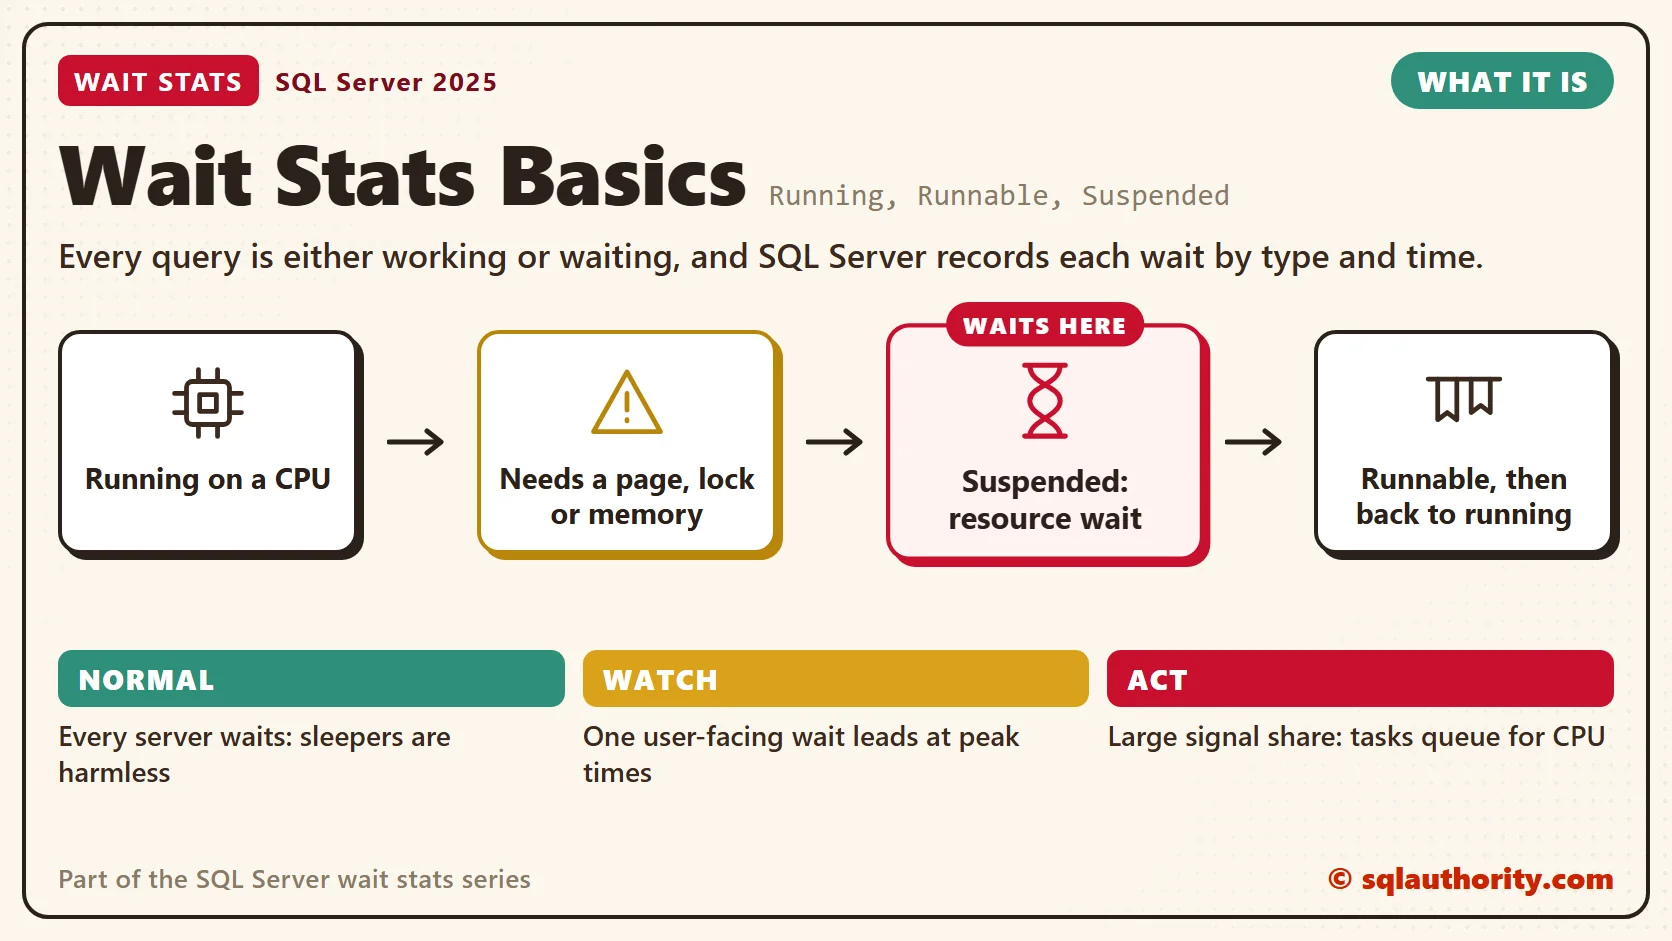
A busy query goes around this loop thousands of times. Each trip through Suspended adds to a wait type. SQL Server keeps a running total for every wait type since the last restart, in a view called sys.dm_os_wait_stats. That view is Casey’s clipboard, and the sys.dm_os_wait_stats post reads it line by line.
One detail trips people up. The total wait time for a wait type already includes its signal wait time. So the resource part is the total minus the signal part. Tomorrow’s post is all about that split.
Why I Start With Waits
In my performance health checks, waits are the first thing I look at. CPU percent and disk counters tell me how busy a server is. Waits tell me what the queries themselves were stuck on. That’s a different question, and it’s usually the one the business cares about.
You could say a good monitoring tool already shows all of this. Fair point, and many do. But the tools read the same views you’ll learn here. When a chart looks strange, you’ll know what’s under it.
It’s tempting to tune the query that looks slowest and stop there. Then the server doesn’t get faster. The real culprit can be a tiny query that runs a million times, waiting on the log each time. The wait list shows that on the first morning.
Normal or a Problem?
| Situation | What it means | What to do |
|---|---|---|
| Your server has waits at all | Normal. Every working server waits. | Look at which waits are on top, not whether there are any. |
| The top waits have names like SLEEP_TASK or LAZYWRITER_SLEEP | Background tasks resting. Harmless. | Filter them out (see Harmless Wait Stats). |
| One user-facing wait leads during your slow hours | A real clue about the bottleneck. | Read that wait’s post in this series. |
| Signal waits are a large share of all waits | Requests wait in line for CPU. | Check CPU pressure (see Signal Wait Stats). |
See It on Your Server
This first query shows what user requests are doing right now. Run it while your server is busy. The status column shows the three states from the diner, plus sleeping and background. For a parallel request, the row shows the coordinator’s wait only.
-- What each user request is doing right now
SELECT r.session_id,
       r.status,
       r.wait_type,
       r.wait_time AS wait_ms,
       r.last_wait_type,
       r.cpu_time AS cpu_ms,
       r.total_elapsed_time AS elapsed_ms
FROM sys.dm_exec_requests AS r
JOIN sys.dm_exec_sessions AS s
    ON s.session_id = r.session_id
WHERE s.is_user_process = 1
ORDER BY r.total_elapsed_time DESC;
Compare cpu_ms with elapsed_ms for a long request. When elapsed time is far bigger than CPU time, the request spent most of its life waiting. The wait_type column says what it’s waiting on at this moment.
The second query is a first look at the clipboard. It splits each wait type into its resource part and its signal part.
-- Which 10 waits used the most time since the last restart, and how does each one split?
-- waited_ms = resource_part_ms + signal_part_ms
SELECT TOP (10)
       wait_type,
       wait_time_ms AS waited_ms,
       wait_time_ms - signal_wait_time_ms AS resource_part_ms,
       signal_wait_time_ms AS signal_part_ms,
       waiting_tasks_count AS times_waited
FROM sys.dm_os_wait_stats
WHERE waiting_tasks_count > 0
ORDER BY waited_ms DESC;
Don’t panic at the top rows. On most servers they’re background tasks that sleep on purpose. The next posts give you a filter that removes them, so the real waits rise to the top.
Fix It
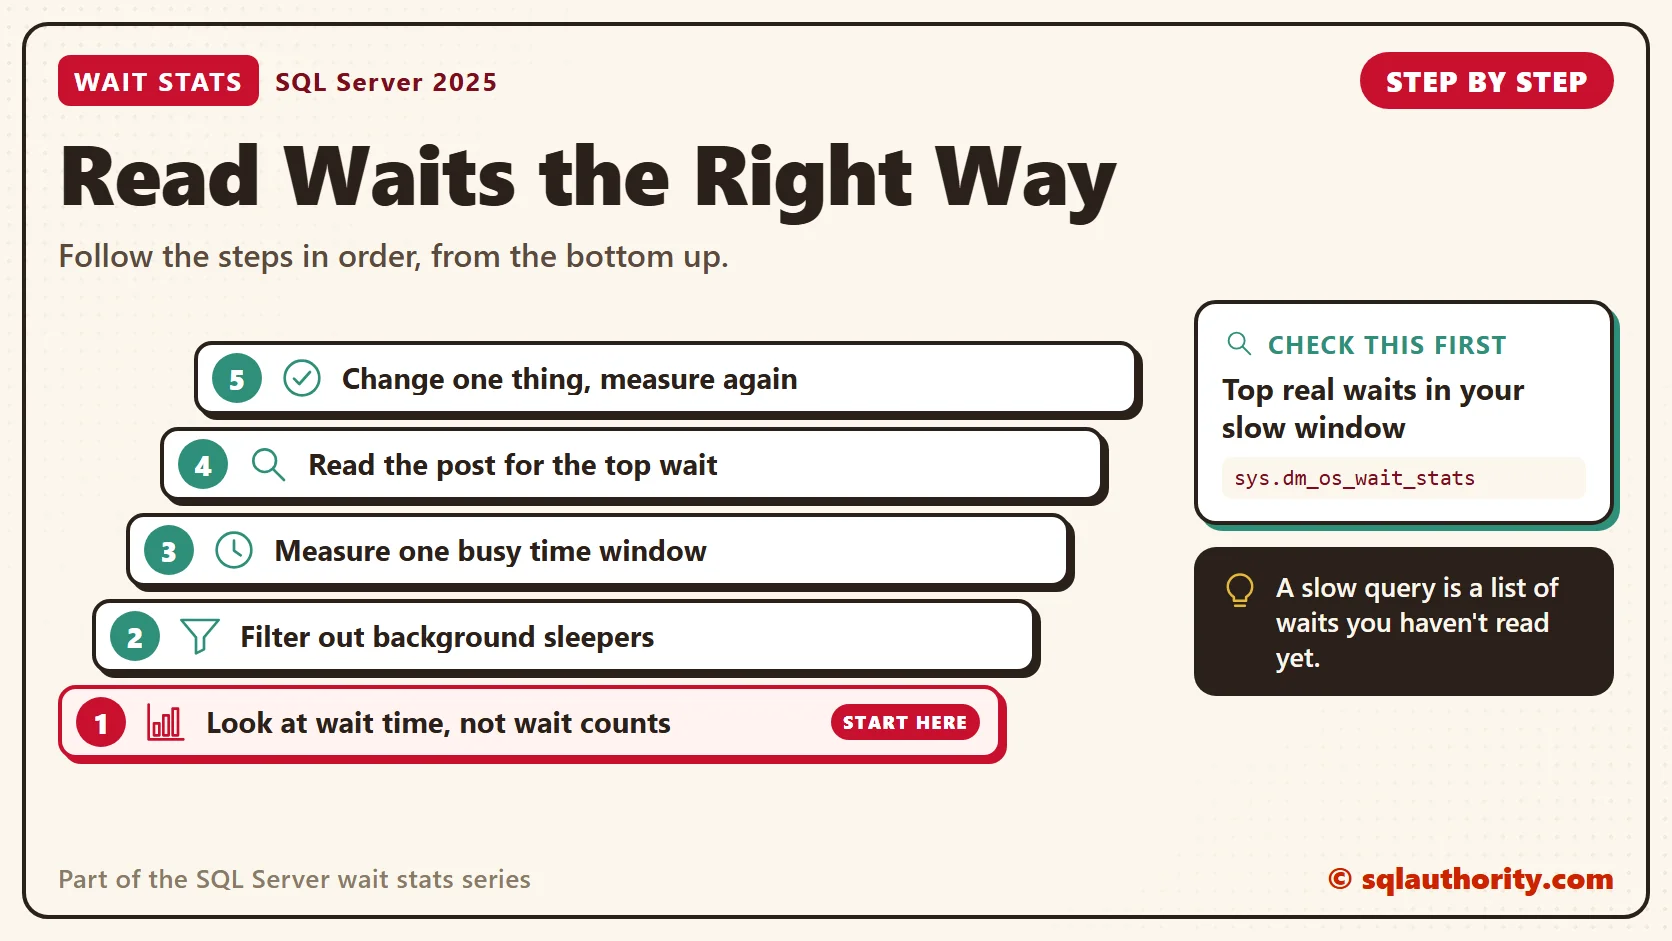
This first lesson has nothing to fix yet. It gives you a habit instead. Here’s the order I follow on every server.
- Look at wait time, not wait counts. A million tiny waits can matter less than ten long ones.
- Filter out the harmless background waits before you read anything.
- Measure a busy time window, not the totals since the last restart (Wait Stats Over Time).
- Take the top real wait and read its post in this series.
- Change one thing, then measure the same window again.
New in SQL Server 2022 and 2025
The three states and the meaning of a wait haven’t changed. What changed is how much SQL Server records for you. Since SQL Server 2022, Query Store is on by default for new databases. It keeps waits per query, grouped into categories, so you can see which query waited and on what.
SQL Server 2025 also turns on DOP feedback by default, in Enterprise and Enterprise Developer editions. It needs compatibility level 160 or higher and Query Store in READ_WRITE mode. That changes the mix of parallel waits on many servers, and Parallelism Wait Stats covers it. New databases on SQL Server 2025 start at compatibility level 170.
Related Reading
- Query Store Wait Stats: Why a Query Was Slow, Not Just That It Was
- Reading the Top Five Wait Types on Your Server
The Clipboard Diner, a wait stats series. Previous: Wait Stats Explained: SQL Server as an All-Night Diner. Next: Signal Wait Stats: CPU Waits vs Resource Waits. Every post is listed in the series guide.
Next, the potatoes arrive right on time, and the hash waits anyway.
A slow query is not a mystery, it is a list of waits you haven’t read yet.
Published by Pinal Dave on SQLAuthority. More of my work at pinaldave.com.
Discover more from SQL Authority with Pinal Dave
Subscribe to get the latest posts sent to your email.



16 Comments. Leave new
Looking forward to seeing what you come up with.
1 of 28.. Fantastic to see 28 posts on this topic….
Thanks a lot
I too will be interested to see your 28 blog posts about this subject. It will be a lot of work, but it will be good for you !
Brilliant topic and looking forward to reading more!
I have often found the documentation for the Wait Types that I have referenced to be vague and well to be honest just not that helpful. I’m hoping that this series will add some meat to the bones.
what is the meaning of joining CTE waits to itself on:
W2.rn <= W1.rn
I just can't figure it out.
Thank you in advance.
Roman.
W1 and W2 are the alias names for Waits and we are joining Waits table with the Waits table again by giving two alias names viz W1 and W2 it on the column rn.
Hence W2.rn<=W1.rn is given to avoid the same matching values coming again and again.
this is what i got
ONDEMAND_TASK_QUEUE 54205.45 99.75 99.75
I have two rows of data executing your query:
DIRTY_PAGE_POLL 429790 46,49.96 49.96
HADR_FILESTREAM_IOMGR_IOCOMPLETION 429754.36 49.95 99.91
Would you please let me know what do they mean. Thanks.
Hi Eric,
Did you solved above waits?
DIRTY_PAGE_POLL can be ignored.
wait_type wait_time_s pct running_pct
PAGEIOLATCH_SH 1444450.86 98.63 98.63
IO_COMPLETION 8863.65 0.61 99.23
Can You Please give what is happening in my system
@Digant Dudharejia: most probably you have a DISK, IO subsystem issue, check with your Storage admin.
I would agree with Hany.
wait_type wait_time_s pct running_pct
CXPACKET 12205236.55 55.59 55.59
PAGELATCH_UP 5460672.73 24.87 80.46
LATCH_EX 2412872.58 10.99 91.45
PAGEIOLATCH_SH 477383.76 2.17 93.63
PAGELATCH_SH 264119.57 1.20 94.83
BROKER_EVENTHANDLER 231293.07 1.05 95.88
SOS_SCHEDULER_YIELD 169129.85 0.77 96.65
EXECSYNC 165021.55 0.75 97.41
LCK_M_S 145500.53 0.66 98.07
LATCH_SH 95372.91 0.43 98.50
BROKER_RECEIVE_WAITFOR 60310.53 0.27 98.78
PAGEIOLATCH_EX 49145.23 0.22 99.00
looks like parallelism and TempDB
CXPACKET 9284436.75 41.35 41.35
SQLTRACE_WAIT_ENTRIES 8432657.06 37.55 78.90
BROKER_EVENTHANDLER 2279408.12 10.15 89.05
LATCH_EX 420773.82 1.87 90.92
PAGEIOLATCH_SH 387884.31 1.73 92.65
OLEDB 303395.27 1.35 94.00
BACKUPBUFFER 279220.37 1.24 95.25
ASYNC_IO_COMPLETION 242254.66 1.08 96.32
BACKUPIO 218730.18 0.97 97.30
PAGEIOLATCH_EX 111566.86 0.50 97.80
SOS_SCHEDULER_YIELD 93330.73 0.42 98.21
IO_COMPLETION 91645.38 0.41 98.62
BROKER_RECEIVE_WAITFOR 84000.28 0.37 98.99
WRITELOG 62652.47 0.28 99.27