Batch mode wait stats such as HTBUILD show threads waiting for each other inside a parallel batch mode plan. One shared hash table or sort has to be ready before anyone moves on. For big analytic queries that’s normal. It turns into a problem when one thread holds everyone else up.

This post is part of my wait stats series, told as one story at the Clipboard Diner. Every post is listed in the series guide.
Night 26 at the Clipboard Diner
The wedding party had left a thank-you note and half a cake. Casey kept the note and counted heads on every big order after that. Night 26 brought a different kind of order: 900 cookies for the school bake sale, due by 6 AM.
Nobody bakes 900 cookies one at a time. At 11 PM the kitchen switched to sheet-pan mode. Kit, Jesse, Ace and Jules each took a bowl of dough. Together they built one giant shared tray, row by row. The rule was simple: nobody bakes until the tray is full.
Casey held the stopwatch. Ace finished portioning first and stood with a spatula, waiting. Kit and Jules joined Ace a minute later. For three minutes, three cooks did nothing. Casey almost wrote “slow” on the clipboard.
Then the tray went into the oven, and the whole kitchen moved at once. Twelve minutes later, 300 cookies came out. No ticket-by-ticket kitchen could do that.
The second tray was different. Jesse’s bowl held all the chocolate chunks, and chunky dough is slow to scoop. The other three finished in four minutes and waited eleven. Casey looked at the four bowls and saw it. The waiting wasn’t the problem. One heavy bowl was.
Casey wrote two lines: Waiting for the tray: fine. Waiting for Jesse’s bowl: split the dough evenly.
What Batch Mode Wait Stats Mean
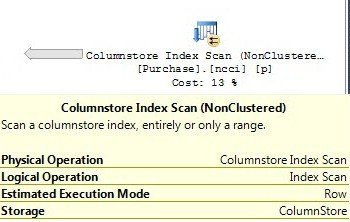
That’s what SQL Server does in batch mode. Row mode passes rows through the plan one at a time. Batch mode handles them in batches of up to about 900 rows. Each operator works on a whole batch at once, so big scans and aggregates run much faster.
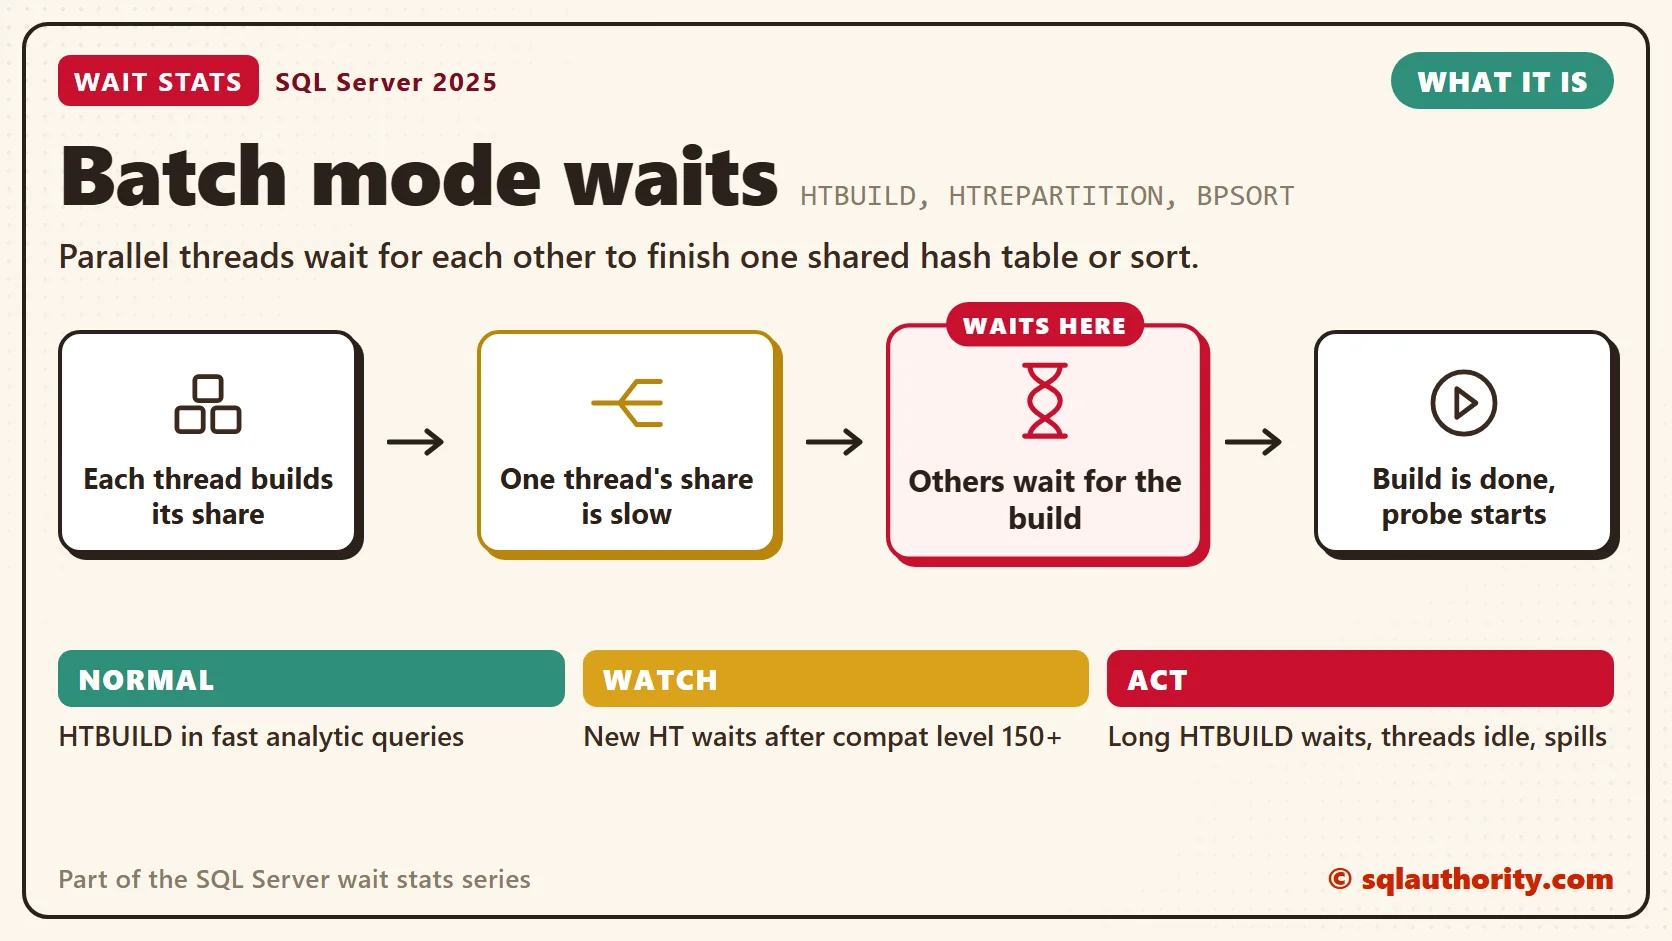
When a batch mode plan runs in parallel, the threads share some structures. A hash join builds one hash table that every thread uses. Before the probe side can start, every thread must finish its share of the build. A thread that’s done early waits for the others, and SQL Server records that wait by name.
- HTBUILD: waiting for the others to finish building the hash table. It’s the one I see most.
- HTREPARTITION: waiting while the hash table on the build side is repartitioned.
- HTMEMO: waiting before the hash table is scanned to output matches or non-matches.
- HTDELETE: waiting at the end of a hash join or aggregation, while it’s cleaned up.
- HTREINIT: waiting before a hash join is reset for the next partial join.
- BPSORT: waiting inside a batch mode sort that several threads share.
Where Batch Mode Comes From
Batch mode started with columnstore indexes. Since SQL Server 2019, it can also run on ordinary rowstore tables, at compatibility level 150 or higher. Batch mode on rowstore is an Enterprise edition feature. Developer edition has it in older versions, and in SQL Server 2025 so does Enterprise Developer, but not Standard Developer. That’s why I see these waits on servers that have no columnstore index at all.
It surprises people after an upgrade. A reporting query that used to run in row mode picks batch mode on its own. It gets faster, and a new wait name shows up on the clipboard. The new name isn’t a new problem.
Normal or a Problem?
| Situation | What it means | What to do |
|---|---|---|
| HTBUILD during reports or analytic queries that run fast | Threads take turns at a shared build. Normal. | Leave it alone. |
| New HT waits after moving to compatibility level 150 or higher | Some queries now use batch mode on rowstore. | Check that those queries got faster. |
| One session with long HTBUILD waits and idle threads | One thread’s share is slow: skew or a spill. | Read the actual plan for that query. |
| HTREPARTITION climbing, with spill warnings in the plan | The hash table ran short of memory. | Fix the memory grant first. |
See It on Your Server
The first query reads the batch mode waits from the clipboard. Look at the average and the max together.
-- Batch mode waits since the last restart
SELECT wait_type,
       waiting_tasks_count,
       wait_time_ms,
       max_wait_time_ms,
       CAST(1.0 * wait_time_ms / NULLIF(waiting_tasks_count, 0) AS decimal(18,2)) AS avg_wait_ms
FROM sys.dm_os_wait_stats
WHERE wait_type IN (N'HTBUILD', N'HTREPARTITION', N'HTMEMO', N'HTDELETE', N'HTREINIT', N'BPSORT')
ORDER BY wait_time_ms DESC;
A small average with a large count is a busy, healthy kitchen. A large max_wait_time_ms means at least one build kept its threads standing for a long time. That’s the query worth finding.
The second query finds it while it runs. It counts how many threads of each session wait on a batch mode wait right now.
-- Sessions whose threads wait on a shared build or sort right now
SELECT wt.session_id,
       wt.wait_type,
       COUNT(*) AS waiting_threads,
       MAX(wt.wait_duration_ms) AS longest_wait_ms,
       r.dop,
       r.granted_query_memory AS granted_memory_pages
FROM sys.dm_os_waiting_tasks AS wt
JOIN sys.dm_os_tasks AS tk
    ON tk.task_address = wt.waiting_task_address
JOIN sys.dm_exec_requests AS r
    ON r.session_id = tk.session_id
   AND r.request_id = tk.request_id
WHERE wt.wait_type IN (N'HTBUILD', N'HTREPARTITION', N'HTMEMO', N'HTDELETE', N'HTREINIT', N'BPSORT')
GROUP BY wt.session_id, wt.wait_type, r.dop, r.granted_query_memory
ORDER BY longest_wait_ms DESC;
When waiting_threads is close to dop for a long time, most of the team is standing around one slow bowl. Take that session_id to the Live Wait Stats queries to get its text and plan.
Fix It
You could say any wait is wasted time, so turn batch mode off. Fair point on paper. But the three cooks who waited for the tray still baked 300 cookies in twelve minutes.
A common overreaction is to force a slow report onto one thread. That report can run four times longer than before. So I fix the slow thread, not the waiting ones.
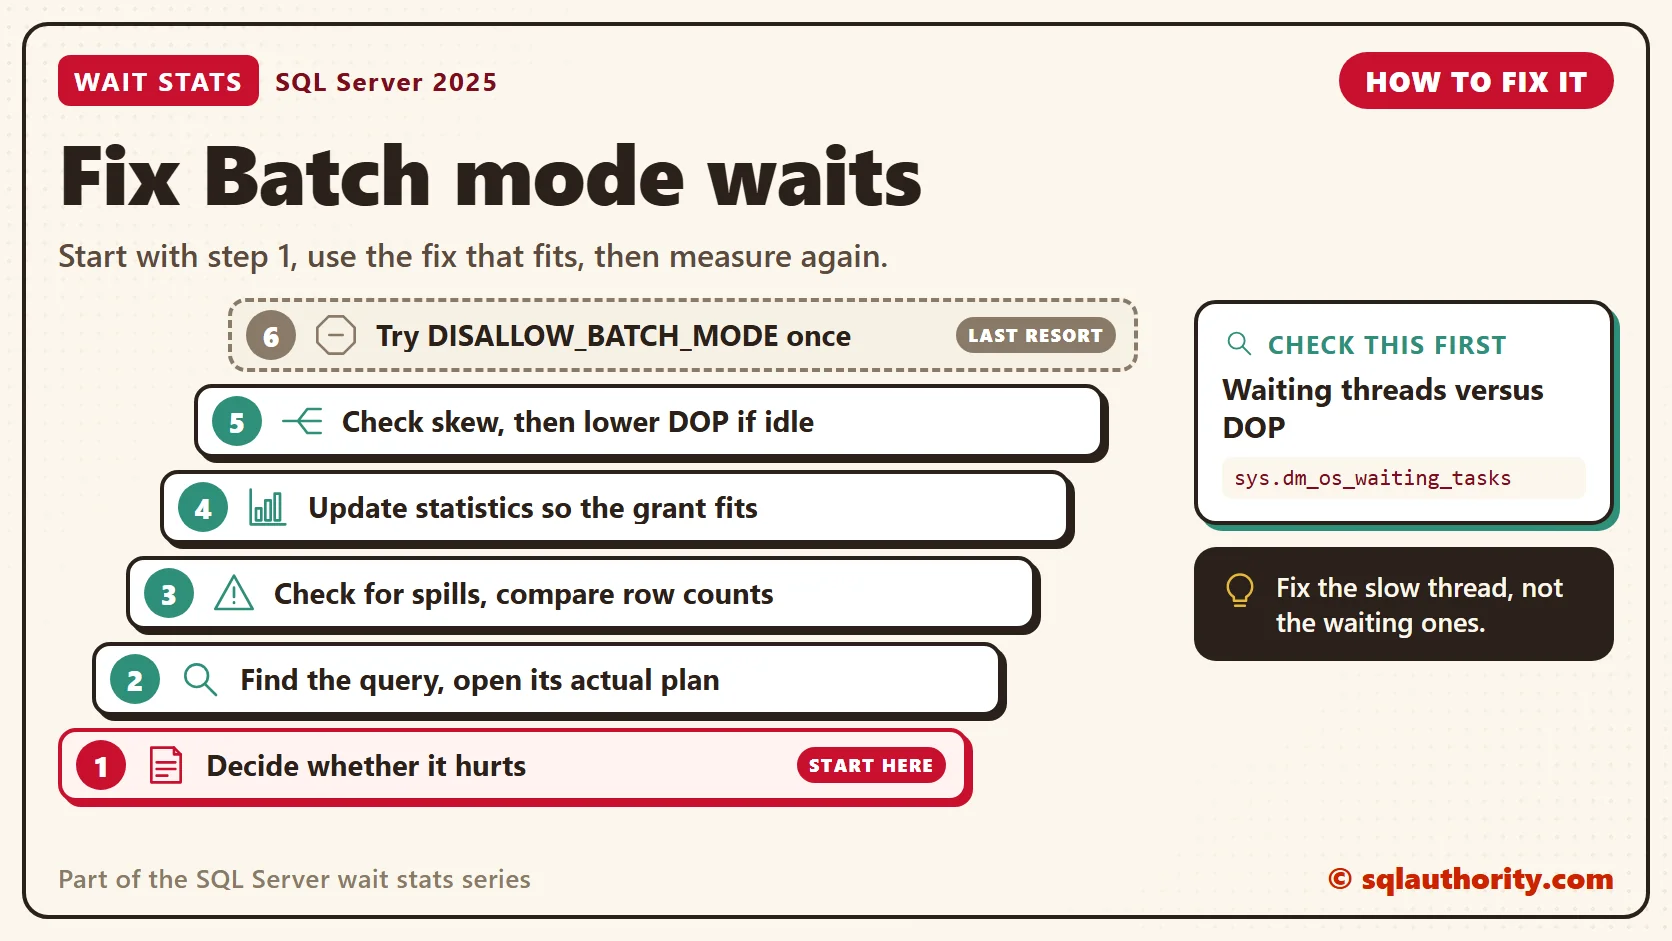
- Decide whether it hurts. If the query is fast enough, leave the waits alone.
- Find the query with the second query, and open its actual execution plan.
- Check the hash join or sort for spill warnings, and compare estimated rows with actual rows.
- Update statistics on the tables feeding the build, so the memory grant fits.
- Check rows per thread in the plan’s properties. A badly uneven split is skew.
- Read RESOURCE_SEMAPHORE Wait Stats if the grant looks wrong.
- Lower the query’s degree of parallelism if most threads mostly wait.
- Only as a test, compare with USE HINT (‘DISALLOW_BATCH_MODE’) on that one query.
New in SQL Server 2022 and 2025
Nothing new changes what these waits mean. Two newer features do touch the plans behind them. In SQL Server 2022, memory grant feedback gained percentile mode and keeps its feedback in Query Store. Both are Enterprise features, at compatibility level 140 or higher with Query Store in READ_WRITE mode. Repeating batch mode queries get steadier grants and fewer spills.
SQL Server 2025 turns on DOP feedback by default in Enterprise and Enterprise Developer editions. It needs Query Store in READ_WRITE and compatibility level 160 or higher. It lowers the parallelism of repeating queries that waste threads, which can shrink these waits by itself. New databases on SQL Server 2025 start at compatibility level 170. On Enterprise edition, batch mode on rowstore is open to them from the start.
Related Reading
- SQL Server 2022: Persistence and Percentile Memory Grant Feedback
- SQL Server 2022: Degree of Parallelism (DOP) Feedback
The Clipboard Diner, a wait stats series. Previous: RESOURCE_SEMAPHORE Wait Stats: Memory Grant Waits. Next: Wait Stats Troubleshooting: From Top Wait to First Fix. Every post is listed in the series guide.
Tomorrow night, Casey tapes one page to the fridge, and the whole month fits on it.
An HTBUILD wait is not a lazy thread, it is a team waiting for one shared tray.
Published by Pinal Dave on SQLAuthority. More of my work at pinaldave.com.
Discover more from SQL Authority with Pinal Dave
Subscribe to get the latest posts sent to your email.