
Parallelism wait stats drop when two settings fit your server: which queries go parallel, and how many threads they get. Cost threshold for parallelism decides the first. MAXDOP decides the second. SQL Server 2025 adds a third helper that learns from your own queries.

This post is part of my wait stats series, told as one story at the Clipboard Diner. Every post is listed in the series guide.
Night 7 at the Clipboard Diner
The blueberry pancakes still bothered Casey the next morning. So did something else. The old rule on the kitchen door said to split any order over five minutes of cooking. Last week a plate of toast for two got three cooks.
Casey took the old sheet down and taped up a new one. Rule one: no party gets more than two cooks. Rule two: split an order only when one cook would need more than twenty-five minutes. Kit read it, shrugged, and said the toast had felt a little crowded.
At 7:05 PM a family reunion of nine sat down. Under the old rule all four cooks would have jumped on it, and the counter would have stopped cold. Tonight Ace and Jules took the reunion. Kit and Jesse kept the counter moving, and three truckers got their pie on time.
Later Casey noticed Dee writing in a small spiral notebook. The quilting circle comes every Tuesday and orders the same twelve plates. Last week four cooks made them. Tonight Dee tried two, and the plates came out as fast. Dee wrote that down for next Tuesday.
Casey smiled and reached for the clipboard: Party of 9, two cooks, 14 min. The counter never stopped.
Two Rules for Parallel Plans
Those two rules on the door are the two settings that shape every parallel plan. The notebook is DOP feedback, and we’ll get to it. If you missed the tour bus, start with CXPACKET Wait Stats, which explains the waits themselves.
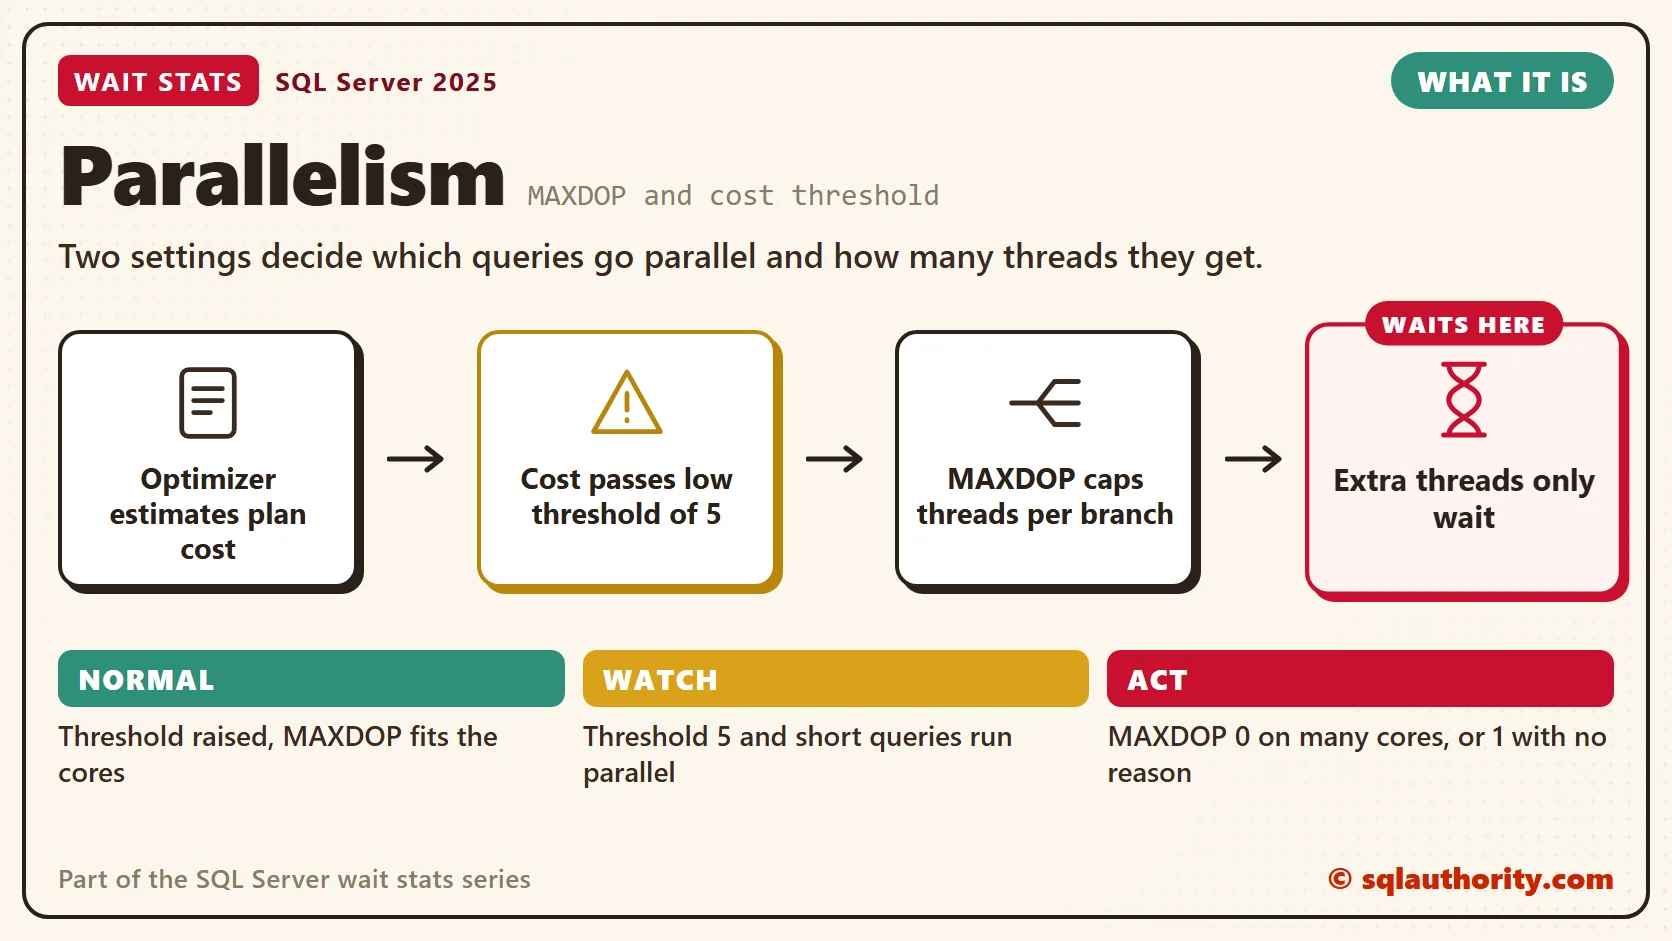
Cost threshold for parallelism is rule two. The optimizer estimates the cost of a serial plan first. Only when that cost is above the threshold does it consider a parallel plan. The default is 5. Cost is an estimate with no unit, so it isn’t seconds.
A cost of 5 is small on today’s hardware. Lots of everyday queries cross it, so short queries go parallel and pay for thread setup they don’t need. That’s the toast with three cooks. I start between 25 and 50, then measure and adjust.
MAXDOP, the max degree of parallelism, is rule one. It caps how many threads each parallel branch of a plan can use. A plan with several branches can use more threads than the number, plus the coordinator. The default of 0 lets one query use every processor, up to 64.
Three Places to Set MAXDOP
You can set MAXDOP at three levels. The server setting is the house default. A database scoped setting overrides it for one database. A query hint overrides both for one statement. A Resource Governor workload group can cap all three, if you use one.
There’s no single right number, and I won’t pretend there is. The common guidance is to keep MAXDOP within one NUMA node, and many servers start at 8 or fewer. Since SQL Server 2019, setup suggests a value for your hardware. That suggestion is a good first step.
It’s a common shortcut to copy one MAXDOP value to every server. Then a server with eight cores and one with sixty-four get the same rule. A few bad nights later, someone checks the hardware. Start there instead.
Normal or a Problem?
| Situation | What it means | What to do |
|---|---|---|
| Cost threshold is still 5, and short queries show a high dop | Small queries go parallel. | Raise it in steps, then measure parallel waits and CPU for a week. |
| MAXDOP is 0 on a server with many cores | One query can take every scheduler. | Set a value from the guidance above. |
| MAXDOP is 1 for the whole server | Big queries run on one thread. | Set a real value, unless a vendor requires 1. Use hints for the few outliers. |
| A reporting database and a busy OLTP database share a server | One value can’t fit both. | Use a database scoped MAXDOP. |
| DOP feedback lowered a query’s DOP | It found threads that only waited. | Leave it. That’s its job. |
See It on Your Server
This first block reads the current rules. The first query shows the server settings and the second shows your processor count. The last one shows the database settings for the database you run it in.
-- Server rules for parallel plans
SELECT name, value_in_use
FROM sys.configurations
WHERE name IN (N'max degree of parallelism', N'cost threshold for parallelism');

-- Processors SQL Server can see
SELECT cpu_count, scheduler_count
FROM sys.dm_os_sys_info;

-- Database rules (run in each database you care about)
SELECT name, value
FROM sys.database_scoped_configurations
WHERE name IN (N'MAXDOP', N'DOP_FEEDBACK');
A database MAXDOP of 0 means the database follows the server setting. A cost threshold of 5 is the install default, so check whether anyone chose it on purpose.
The second query shows which requests are running parallel right now. Run it during a busy hour.
-- Requests running with more than one thread
SELECT r.session_id,
       r.dop,
       r.cpu_time AS cpu_ms,
       r.total_elapsed_time AS elapsed_ms,
       r.wait_type,
       t.text AS query_text
FROM sys.dm_exec_requests AS r
CROSS APPLY sys.dm_exec_sql_text(r.sql_handle) AS t
WHERE r.dop > 1
ORDER BY r.dop DESC;
Look for short, simple statements with a high dop. Those are your toast orders with three cooks. When they keep showing up, the cost threshold is too low for your workload. A setting alone isn’t proof.
Fix It
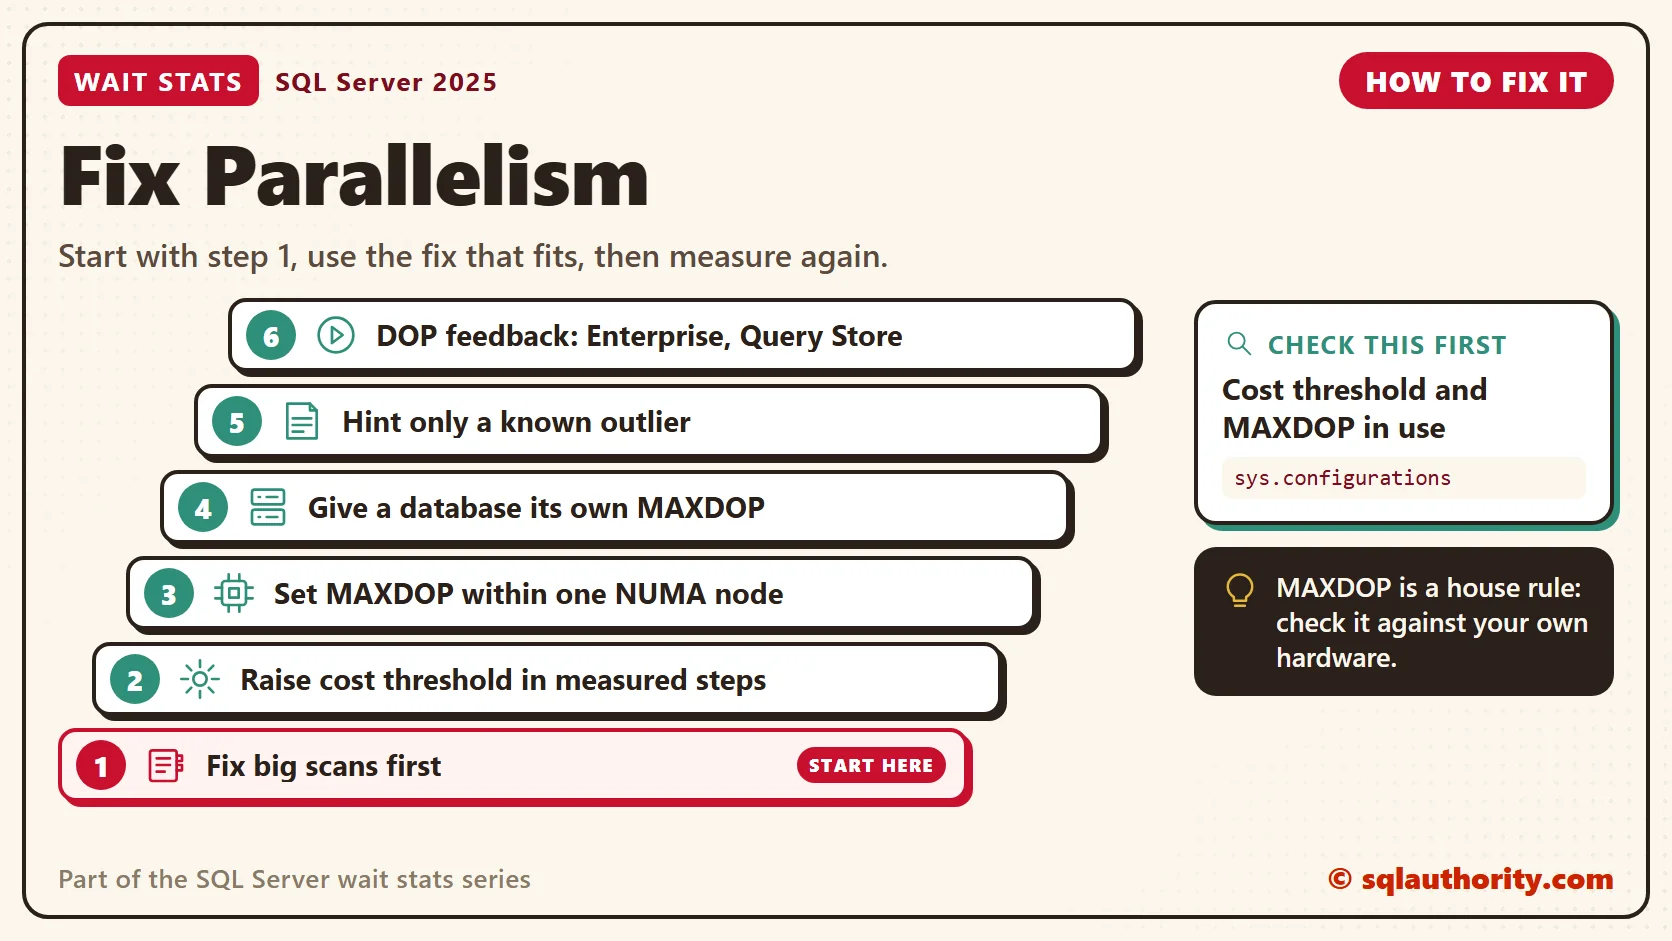
- Fix the big scans first. A missing index is cheaper to fix than any setting, as the CXPACKET post explains.
- When short queries keep going parallel, raise cost threshold for parallelism from 5, in steps. Measure parallel waits and CPU before and after.
- Set server MAXDOP from the guidance: within one NUMA node, and start at 8 or fewer.
- Give a database its own MAXDOP when its work differs from the rest of the server.
- Use a query hint only for a known outlier. Hints are easy to forget and hard to find later.
- On Enterprise edition, turn on DOP feedback in SQL Server 2022, or leave it on in 2025, with Query Store running.
These commands change settings, so try them on a test server first. The numbers in them are examples, not answers. Pick yours from the guidance above.
-- Server level (both are advanced options); example values
EXEC sys.sp_configure N'show advanced options', 1;
RECONFIGURE;
EXEC sys.sp_configure N'cost threshold for parallelism', 50;
EXEC sys.sp_configure N'max degree of parallelism', 8;
RECONFIGURE;

-- Database level, run inside the database
ALTER DATABASE SCOPED CONFIGURATION SET MAXDOP = 4;

-- Query level, for one statement only
SELECT type_desc, COUNT(*) AS object_count
FROM sys.objects
GROUP BY type_desc
OPTION (MAXDOP 2);

-- SQL Server 2022 Enterprise: turn on DOP feedback (on by default in 2025)
ALTER DATABASE SCOPED CONFIGURATION SET DOP_FEEDBACK = ON;
New in SQL Server 2022 and 2025
DOP feedback is Dee’s notebook. SQL Server 2022 introduced it as an opt-in feature at compatibility level 160. SQL Server 2025 turns it on by default. It needs Query Store in READ_WRITE mode and compatibility level 160 or higher. It’s an Enterprise feature, so Standard and Express don’t get it.
It watches parallel queries that repeat. When the extra threads only wait, it lowers the DOP for that query on later runs. It checks each lower DOP against the query’s elapsed time and waits. When the query regresses, it goes back to the last good DOP. After an upgrade to 2025, check each database’s compatibility level. At 160 or higher, with Query Store on, some parallel waits shrink on their own.
You could say DOP feedback makes MAXDOP tuning pointless. Fair point for the queries that repeat. But it only lowers DOP, and it only learns from repeats. A one-time monster report still follows your server rules, so set them well.
Related Reading
- Cost Threshold for Parallelism and MAXDOP: Setting Both Together
- 3 Different Ways to Set MAXDOP
- Do Queries Always Respect Cost Threshold of Parallelism?
- DOP Feedback: Letting SQL Server Lower Parallelism by Itself
- SQL Server 2022 Degree of Parallelism (DOP) Feedback
The Clipboard Diner, a wait stats series. Previous: CXPACKET Wait Stats: What Parallel Waits Mean. Next: SOS_SCHEDULER_YIELD Wait Stats: Reading CPU Pressure. Every post is listed in the series guide.
Then comes a night when every cook wants a burner at once, and nobody gets to keep one.
MAXDOP is not a magic number, it is a house rule you check against your own kitchen.
Published by Pinal Dave on SQLAuthority. More of my work at pinaldave.com.
Discover more from SQL Authority with Pinal Dave
Subscribe to get the latest posts sent to your email.


4 Comments. Leave new
hi,
we are encountering cxpacket issues in our production system
when we are supplying 160 gb file on 6 th day of every month and this file
won’t be supplied every day.whenever we are supplying the file only during next day we got error.(cxpacket).
when the package was executing on first time after supplying the file
the issue cxpacket come and if the query was killed and we try to execute the same package using the below mentioned query scenario.the run was susccessful.plaese give solution on this as aeraly as possible.
the query that we used are used is delete statement calling select statement.
Hi Pinal,
I’m also facing the same type issue as Anu. Could you please tell us the solutions ..
Arindam Das
I have to solution which will work for your environment.
Under Potential reasons, you mean, “INCORRECT amount of the data”, right?