
Live wait stats show what each SQL Server request is waiting on right now, and who is in its way. The totals since the last restart tell you what usually hurts. The live views tell you what hurts right now, and they name the session that’s causing it.

This post is part of my wait stats series, told as one story at the Clipboard Diner. Every post is listed in the series guide.
Night 4 at the Clipboard Diner
Last night Casey read history at 2 AM. Tonight was Saturday, and at 7:15 PM the clipboard stayed on its hook. History could wait. Casey wanted to know what was stuck right now.
The diner roared. The jukebox played its one song for the third time, and the door bell never stopped. Four burners hissed under four pans. Casey walked the line slowly and asked every ticket the same two questions. What are you waiting for? Who’s in your way?
Most answers came fast. One ticket waited on hash browns from the basement, and two sat on the rail for a burner. But three tickets hung together on the spike under a scrap of paper that read booth 7. Each was for a party of six, and booth 7 is the only table that seats six. Quinn had taken the orders at the door. The kitchen never fires a plate before the party has a seat.
Casey looked across the room. Booth 7 held a cheerful party with empty pie plates and cold coffee. The red Reserved card still stood on the table. They had finished an hour ago. They weren’t waiting for anything, so nobody in the kitchen had noticed them.
Casey walked over with the check and a smile, and the booth was clear in five minutes. Three tickets fired at once. Back at the hook, Casey wrote: Booth 7 waits on nothing. Three tickets wait on booth 7.
What Live Wait Stats Show
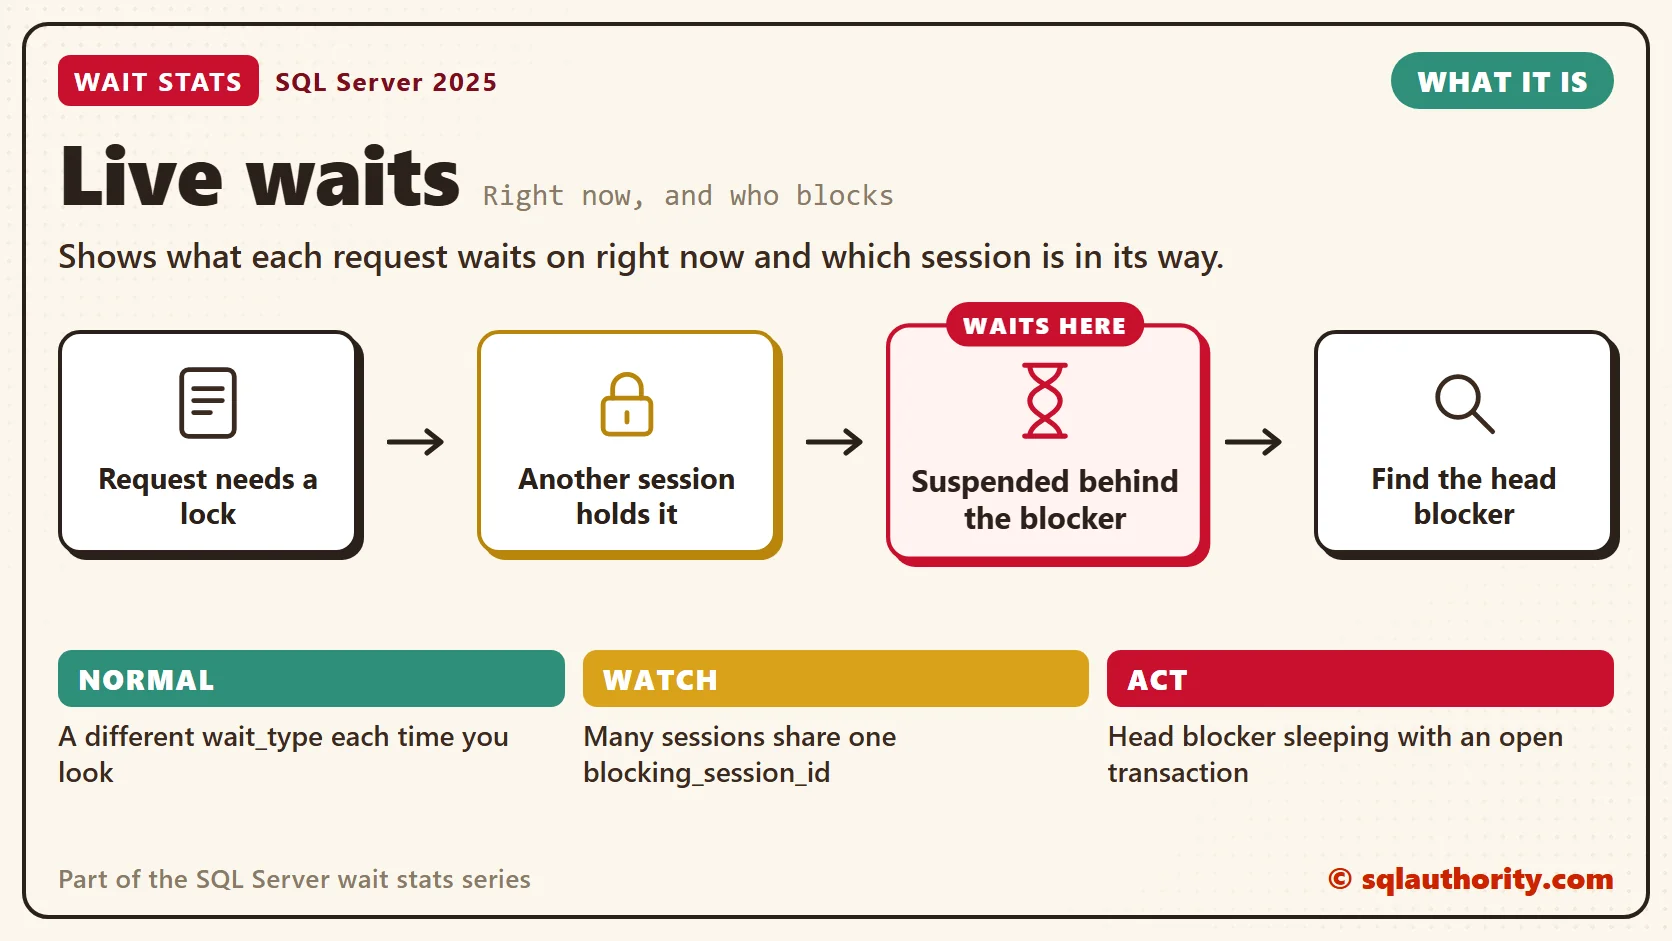
That’s what blocking looks like in SQL Server. The sessions that wait show up everywhere. In many blocking chains, the session causing the wait is idle, holding its locks inside a transaction it never finished.
The clipboard from the sys.dm_os_wait_stats post is history. It can tell you that lock waits are a problem on this server. It can’t tell you who is blocking whom at 7:15 tonight. For that you need the live views.
sys.dm_exec_requests has one row for every request running right now. Its status column says running, runnable or suspended. The wait_type column names the current wait, and wait_time says how long it has lasted so far, in milliseconds. The wait_resource column says what the request waits for, such as a key, a page or an object.
The blocking_session_id column is the most useful one in the view. When it holds a session number, that session holds something this request needs. Follow those numbers up the chain, and you reach a session that blocks others but isn’t blocked itself. That’s the head blocker.
sys.dm_os_waiting_tasks looks at the same moment from another side. It has one row for every waiting task, not one per request. A parallel query shows a row for each waiting thread, told apart by exec_context_id. It includes system tasks too, so I filter it to user sessions.
Where the Head Blocker Hides
This is the part that fools people. An idle head blocker has no row in sys.dm_exec_requests at all. It finished its last statement, so nothing is running. But its transaction is still open, so it keeps the locks that protect its work until it commits. Which locks those are depends on the isolation level, and they’re enough to block others.
sys.dm_exec_sessions still shows it. Look for status sleeping, an open_transaction_count above zero, and an old last_request_end_time. In my health checks, the common cause is an application that opened a transaction and never committed it. An error handler that skips the commit does the same thing.
Ending it is a choice, not a reflex. KILL rolls back the whole transaction. Without accelerated database recovery (ADR), the locks stay held until the rollback finishes. Killing an hour-long import on a busy Friday is the classic way to learn this. The rollback can block everyone longer than the import would have. With ADR on, the locks go quickly, but the business still has to agree.
You could say a live view shows only one moment, and one moment can mislead. Fair point. A single run is a photo, not a movie. I run these queries several times, a few seconds apart, and I trust what keeps showing up.
Waits for One Session
Sometimes the question is narrower: what did my report wait on? Since SQL Server 2016, sys.dm_exec_session_wait_stats answers it. It has the same columns as the server-wide view, plus a session_id. The counts start when the session connects and reset when a pooled connection is reused.
Normal or a Problem?
| Situation | What it means | What to do |
|---|---|---|
| A request shows a different wait_type each time you look | Normal. It’s moving through its work. | Nothing. Look for waits that repeat. |
| A request is runnable with no current wait_type | It’s in line for a CPU. | Check CPU pressure (see Signal Wait Stats). |
| Several sessions wait on LCK_M_ waits with the same blocking_session_id | A blocking chain. | Find the head blocker (see LCK_M Wait Stats). |
| The head blocker is sleeping with an open transaction | An application started a transaction and stopped. | Find the program and fix the missing commit. |
| One parallel query shows many rows waiting on CXPACKET or CXCONSUMER | Threads of one query waiting on each other. | Usually normal (see CXPACKET Wait Stats). |
See It on Your Server
The first block lists every waiting user task with its blocker and its SQL text. Then it lists the head blockers, including sleeping sessions that hold an open transaction. It builds the chain from waiting tasks, so a blocked thread inside a parallel query counts too. Run it a few times while the server is busy.
-- Every waiting user task, and who is in its way
SELECT wt.session_id,
       wt.exec_context_id,
       wt.wait_type,
       wt.wait_duration_ms,
       wt.blocking_session_id,
       wt.resource_description,
       r.status,
       r.wait_resource,
       t.text AS sql_text
FROM sys.dm_os_waiting_tasks AS wt
JOIN sys.dm_exec_sessions AS s
    ON s.session_id = wt.session_id
LEFT JOIN sys.dm_os_tasks AS tk
    ON tk.task_address = wt.waiting_task_address
LEFT JOIN sys.dm_exec_requests AS r
    ON r.session_id = tk.session_id
   AND r.request_id = tk.request_id
OUTER APPLY sys.dm_exec_sql_text(r.sql_handle) AS t
WHERE s.is_user_process = 1
ORDER BY wt.wait_duration_ms DESC;

-- Head blockers: they block others, and nothing blocks them
-- Each waiting task gives one link; a session waiting on itself is parallel work, not blocking
WITH links AS (
    SELECT DISTINCT wt.session_id, wt.blocking_session_id
    FROM sys.dm_os_waiting_tasks AS wt
    WHERE wt.session_id IS NOT NULL
      AND wt.blocking_session_id > 0
      AND wt.blocking_session_id <> wt.session_id
)
SELECT s.session_id,
       s.status,
       s.login_name,
       s.host_name,
       s.program_name,
       s.open_transaction_count,
       s.last_request_end_time
FROM sys.dm_exec_sessions AS s
WHERE s.session_id IN (SELECT l.blocking_session_id FROM links AS l)
  AND s.session_id NOT IN (SELECT l.session_id FROM links AS l);
In the first result, look for waits that repeat across runs and for one blocking_session_id shared by many rows. In the second, a sleeping status with open_transaction_count above zero is your booth 7. The login_name, host_name and program_name columns tell you whom to call.
The second block shows what one session has waited on since it connected. Change the variable to the session you care about.
-- Waits for one session since it connected (SQL Server 2016 and later)
DECLARE @session_id int = @@SPID;  -- change to the session you want
SELECT TOP (10)
       wait_type,
       waiting_tasks_count,
       wait_time_ms,
       signal_wait_time_ms,
       max_wait_time_ms
FROM sys.dm_exec_session_wait_stats
WHERE session_id = @session_id
ORDER BY wait_time_ms DESC;
The top row is where that session spent its waiting time. Read it the same way you read the server-wide list.
Fix It
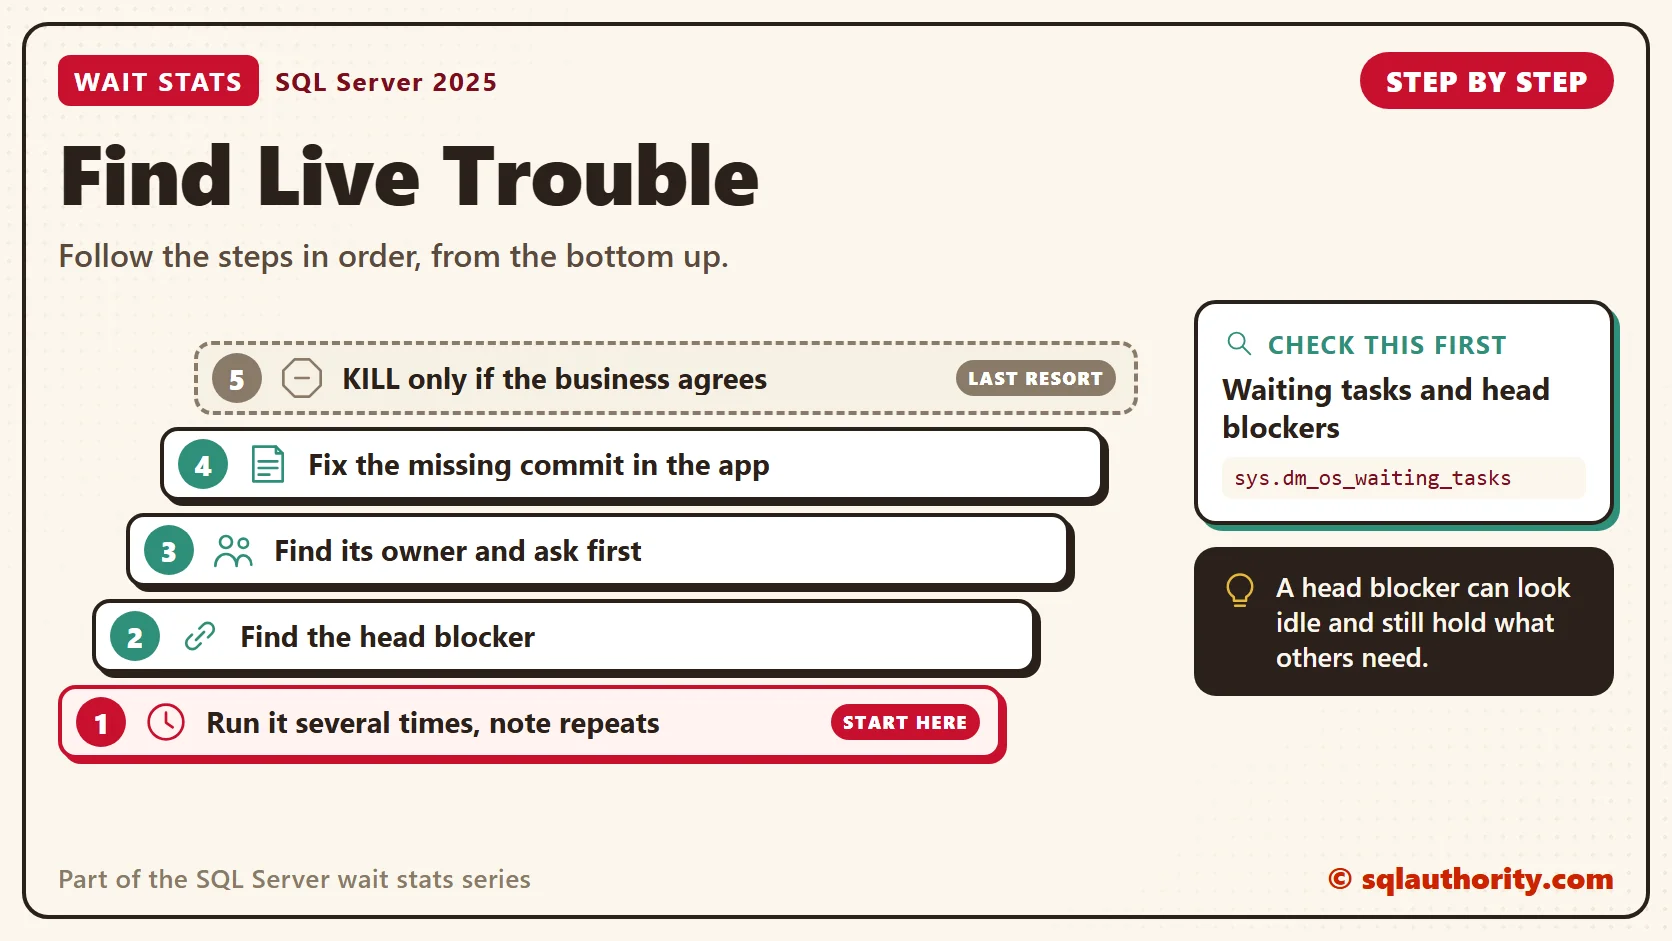
When the live views show a blocking chain, this is the order I follow.
- Run the waiting tasks query several times and note the waits that keep showing up.
- When many sessions share one blocking_session_id, run the head blocker query.
- Find out who owns the head blocker from login_name, host_name and program_name. Ask before you act.
- Fix the cause in the application: commit sooner and keep transactions short.
- Use KILL only when the business agrees. Without ADR, expect the rollback to take time.
- For one slow report, read its session waits and go to the post for its top wait.
New in SQL Server 2022 and 2025
These views work the same way on SQL Server 2025. What can change is what a blocked session shows. Optimized locking is new in SQL Server 2025, and it’s off by default. With it on, a writer holds one lock on its transaction ID. It no longer keeps every row lock to the end.
So a blocked session can wait on a transaction rather than a row. You’ll see waits such as LCK_M_S_XACT_READ, LCK_M_S_XACT_MODIFY and LCK_M_S_XACT. The Optimized Locking Wait Stats post covers them. The head blocker hunt stays the same.
Related Reading
- Following a Blocking Chain to the Head Blocker
- Diagnosing Blocking Chains With sys.dm_exec_requests
- Blocking Tree: Identifying Blocking Chain Using SQL Scripts
- Get Wait Stats Related to Specific Session ID With sys.dm_exec_session_wait_stats
- Decoding wait_resource: From a KEY or PAGE Lock to the Table
The Clipboard Diner, a wait stats series. Previous: sys.dm_os_wait_stats: Reading the Wait Stats List. Next: Wait Stats Over Time: Measuring One Time Window. Every post is listed in the series guide.
Next, Casey wants the story of one dinner hour, not every hour since the clipboard started.
A head blocker is not always busy, it is the session holding what the others need.
Published by Pinal Dave on SQLAuthority. More of my work at pinaldave.com.
Discover more from SQL Authority with Pinal Dave
Subscribe to get the latest posts sent to your email.



15 Comments. Leave new
i have a question.your blog is very usefull to me.how can i import from foxpro (dbf)to sql server 2008 with openrowset ?
i know how to import from excel,but from dbf no.thanks a lot dave.
Have you tried using a Linked Server?
Cannot initialize the data source object of OLE DB provider “MSDASQL” for linked server “(null)”.
I have used your blog for many issues and solutions, so many thanks!
However, this is one I cannot seem to find anything in regards to it.
We are trying to figure out why we have a procedure, same object_id, same database_id that is listed twice in this view sys.dm_exec_procedure_stats. I know it is possible to have the same procedure name listed, but everything tells me that this must have a different object_id. In our situation we have the same Object_Id and Database_Id for this one procedure.
When this situation happens the procedure run times are extremely long, most timeout after several minutes. Normal run times are sub-second for this procedure.
We have tried rebuilding indexes, but that had no effect on this issue.
Only way we have resolved this is to drop and create the procedure.
Anyone advise you can offer on this weird situation?
The view returns one row for each cached stored procedure plan, and the lifetime of the row is as long as the stored procedure remains cached.
Hello Pinal,
My server has 4CPUs 32bit sql server 2008 OS:windows 2008.
I hav been facing a problem maximum CPU utilization by sql server(90 to 100%)there is only one database that is extensively used and only one application.But still the cpu utilization suddenly increases to 100% and the application gets hanged and we have to sometimes restart the server.Have enabled the Awe settin which was not there before and also monitored the server it shows high wait times for CXPACKET,ASYNC_NW_IO,LATCH_EX,SOS_SCHEDULAR_YEILD,
Hence i changed the MDOP which was 0 to 3 and it worked fine for a week but now again it is showing huge wait time for SOS_Schedular_yeild.
Also have to mention that there is only one drive i.e D: drive on the server. I am new to the performance issues hence unable to decide on whether we can use performance monitor to detect this as not sure of the counters to be used.
Its has 8GB memory.Also checked for blocking and updated the ststistics and also reindexed the tables .
Please assist in the same……..
Hi Pinal,
Thank you very much for detailed explanation on wait times.
Could you please provide me some detailed info on exec_context_id column in sys.dm_os_waiting_tasks?
For a session_id I have different exec_context_ids and they were getting blocked by these context_ids.
For example
session_id exec_context_id wait_type blocking_session_id blocking_exec_context_id
75 4 CXPACKET 75 11
75 8 PAGEIOLATCH_EX NULL NULL
75 9 CXPACKET 75 11
75 9 CXPACKET 75 11
75 12 CXPACKET 75 11
75 12 PAGEIOLATCH_EX NULL NULL
75 0 PAGEIOLATCH_EX NULL NULL
75 3 CXPACKET 75 11
75 7 PAGEIOLATCH_EX NULL NULL
75 10 PAGEIOLATCH_EX NULL NULL
75 10 CXPACKET 75 11
75 11 CXPACKET 75 11
75 11 CXPACKET 75 8
Could you please check above details and suggest me whether there is any problem with wait times or not.
Thanks,
Siva Prasad
my results are blank when I run this (0 row(s) affected)
I have the same problem. Blank result.
why a running query also has wait_type ??
when running this query on our servers, it only returns the query itself. there is nothing else shown. we are using a sql server std 2005 edition system.
I think you don’t have any workload running on the server. That is the reason you are getting just this query.
Hi Pinal,
When I am Executing This Query Some TIme Iam Not getting All The Queries Running in my Server.If It Is giving the Result It just pointing out the only Particular Database
Why It is not showing all the databases
Can you let me know if you tried to run any workload on some other database and see the output? This will return for all databases because we have no filters attached in the above query.
I’m like a year too late but i think this indicates you have no waiting tasks