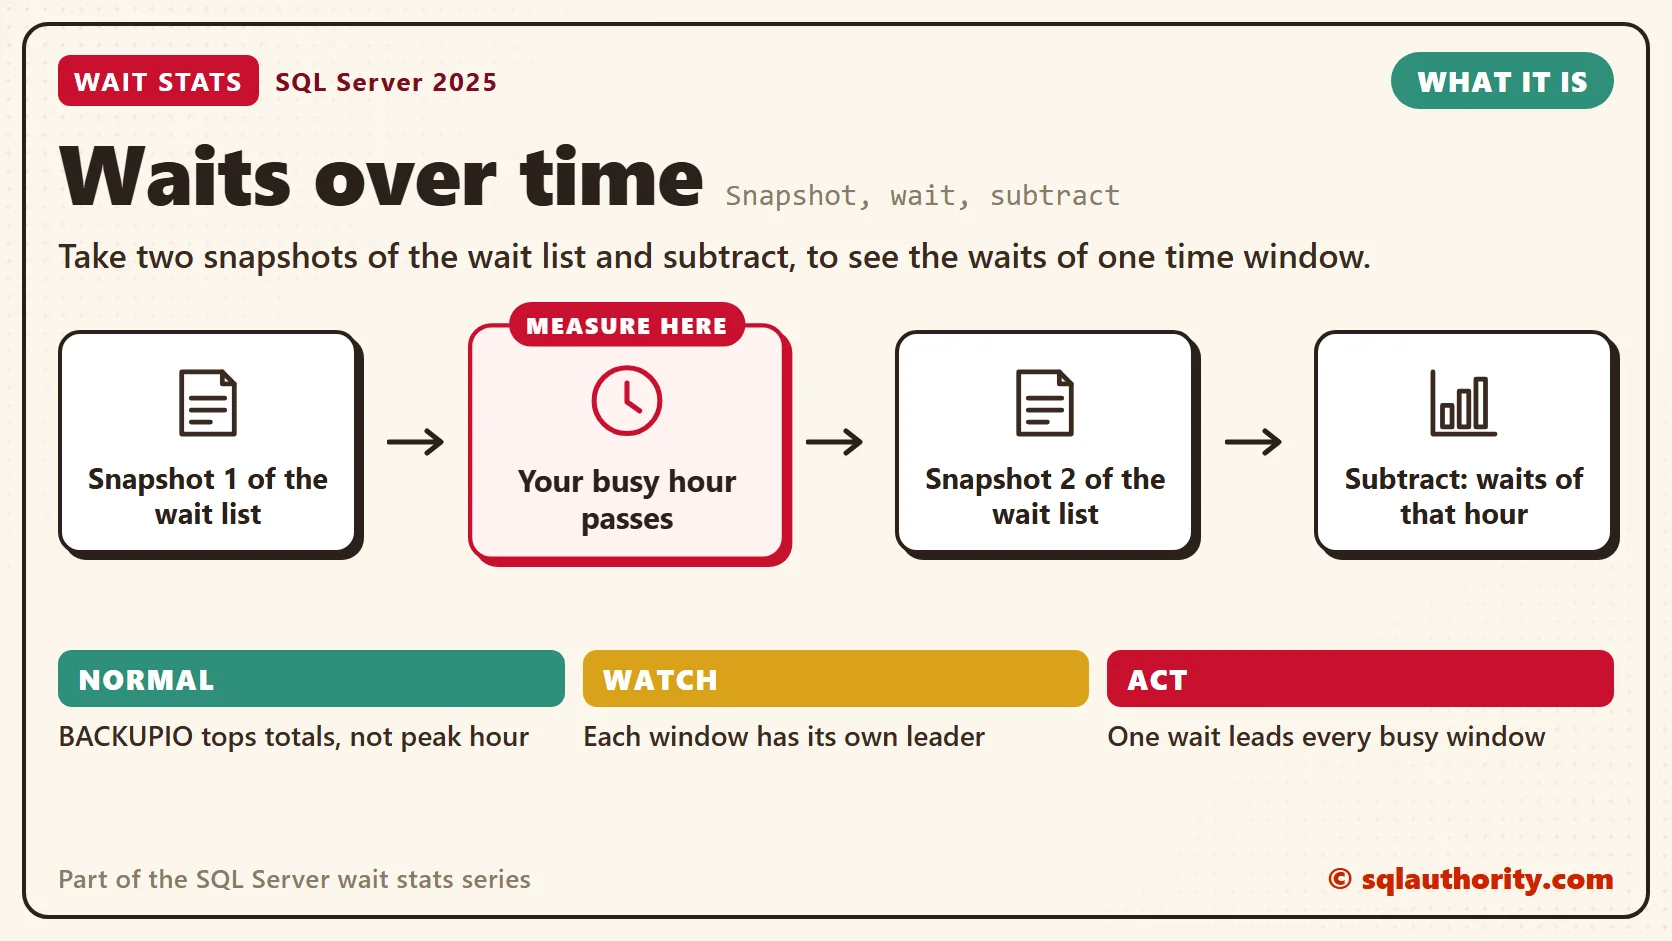
Wait stats over time means measuring the waits of one window, such as your busy hour. Totals since the last restart blend every hour together, backups and quiet nights included. Take two snapshots and subtract, and what’s left is the story of that one hour.

This post is part of my wait stats series, told as one story at the Clipboard Diner. Every post is listed in the series guide.
Night 5 at the Clipboard Diner
After last night’s booth 7 rescue, Casey trusted the clipboard less and the stopwatch more. The clipboard kept running totals, line by line, since the first night of the countdown. Every tally from every hour sat on one page. Casey wanted to know about dinner, and the page couldn’t say.
So at 6:00 PM, with the sun going down over the highway, Casey grabbed the old instant camera. One photo of the clipboard. Pat asked why Casey didn’t erase the page and start fresh. Casey pointed at five nights of notes. “Then I’d lose all of this.”
At 7:00 PM, after the dinner rush peaked, Casey took a second photo. Then Casey sat at the counter with a pencil and a paper placemat and subtracted, line by line.
After the sleepers, the biggest line was the night truck, hours of waiting at the dock around 3 AM. In the dinner hour, the truck didn’t move the needle at all. The hour belonged to the basement stairs, cooks running down for hash browns again and again. Casey pinned both photos to the cork board. The verdict went on the clipboard: 6 to 7 PM: the stairs, not the truck.
What Wait Stats Over Time Means
That’s what you do on SQL Server when the totals since the last restart hide your busy hour. Take a snapshot of sys.dm_os_wait_stats, wait, take another, and subtract. What’s left is the waiting that finished in that window.
Totals since restart are a blend. A server that’s been up for 60 days carries every nightly backup, every weekend index job and every quiet Sunday. Your users feel the busy hour, and the blend buries it.
The math is plain subtraction, done per wait type. The waits in the window are the second count minus the first. The wait time in the window is the second total minus the first. From there, the share, average and signal part work as in the sys.dm_os_wait_stats post, with the same filter list.
One detail matters for long waits. A wait’s time joins the total when the wait ends. A ten-minute block still in progress at the second snapshot won’t show up yet. The views in Live Wait Stats catch that one while it happens. The count works the other way: it goes up when a wait starts. So a long wait that began before the first snapshot adds its time but no count. That pushes the average up.
Picking the Window
My script waits one minute, which makes a quick first try. For a real answer, measure the window your users complain about. In my health checks, I use 15 minutes or a full hour. Then I run it again in a quiet hour to compare. Run one copy at a time, in a fresh query window with no open transaction. The waiting script holds a worker thread, so skip it when the server runs out of workers.
WAITFOR DELAY holds your query window open for the whole time. The wait it records, WAITFOR, is on the filter list, so your own session won’t show up in the result. If someone clears the stats between the snapshots, the numbers are wrong. The script stops when any counter goes down. A clear early in the window can still slip past, so agree that nobody clears stats during a run. A restart ends your session, so the script stops with an error.
Blended totals make it easy to tune the wrong thing. Say the top wait since restart is BACKUPIO, from the nightly backups. A team spends a day on backup speed. But the slow hour users mean is 10 AM, and its top wait is a lock wait. One delta at 10 AM would have saved that day.
You could say a monitoring tool already takes these snapshots. Fair point, and a good tool does it every few minutes. But this script works on any server, today, with nothing to install. When a tool’s chart looks odd, it’s also how I check the chart.
Which Query Waited?
A delta tells you what the server waited on. It doesn’t tell you which query did the waiting. Query Store does, per query plan, grouped into wait categories. My post on Query Store wait stats shows how to read it.
For a single run of one query, the actual execution plan lists its top waits too. That’s covered in Wait Statistics from Query Execution Plan.
Normal or a Problem?
| Situation | What it means | What to do |
|---|---|---|
| BACKUPIO leads the totals, but not the busy-hour delta | Nightly backups dominate the blend. | Tune the busy-hour wait first. |
| The delta is nearly empty | The server was quiet in that window. | Measure when users complain. |
| The script stops with a cleared stats error, or numbers look far too small | A manual clear happened in between. | Discard the run and take a new one. |
| One wait leads every busy window | That’s your real bottleneck. | Read the post for that wait. |
| Different windows show different leaders | Different workloads run at different times. | Keep a baseline for each window. |
See It on Your Server
This script takes a snapshot, waits, takes a second snapshot and shows the difference. Both snapshots land in one temp table as photo 1 and photo 2, like Casey’s two pictures. It keeps only waits that grew and skips the 87 harmless ones, using the list from the sys.dm_os_wait_stats post. Run the full block in its own query window, because it stays busy for the whole delay.
-- Which waits grew during one time window? (SQL Server 2016 and later)
-- Run the whole block at once: the list, both photos and the result share one batch.
-- The harmless list: background housekeeping and deliberate pauses, not user work.
-- why: sleep = sleeps until needed, idle = waits for background work, startup = only at startup,
-- waitfor = asked to wait, broker/ag/trace/qstore/fulltext/xtp/clr = feature housekeeping,
-- internal = internal background task.
DECLARE @harmless TABLE (wait_type nvarchar(60) PRIMARY KEY, why varchar(10) NOT NULL);
INSERT @harmless (wait_type, why) VALUES
    (N'LAZYWRITER_SLEEP', 'sleep'), (N'SLEEP_BPOOL_FLUSH', 'sleep'), (N'SLEEP_TASK', 'sleep'),
    (N'SP_SERVER_DIAGNOSTICS_SLEEP', 'sleep'), (N'CHECKPOINT_QUEUE', 'idle'),
    (N'DIRTY_PAGE_POLL', 'idle'), (N'DISPATCHER_QUEUE_SEMAPHORE', 'idle'),
    (N'KSOURCE_WAKEUP', 'idle'), (N'LOGMGR_QUEUE', 'idle'), (N'ONDEMAND_TASK_QUEUE', 'idle'),
    (N'PREEMPTIVE_SP_SERVER_DIAGNOSTICS', 'idle'), (N'REQUEST_FOR_DEADLOCK_SEARCH', 'idle'),
    (N'RESOURCE_QUEUE', 'idle'), (N'SERVER_IDLE_CHECK', 'idle'), (N'SNI_HTTP_ACCEPT', 'idle'),
    (N'SOS_WORK_DISPATCHER', 'idle'), (N'UCS_SESSION_REGISTRATION', 'idle'),
    (N'VDI_CLIENT_OTHER', 'idle'), (N'CHKPT', 'startup'),
    (N'PWAIT_ALL_COMPONENTS_INITIALIZED', 'startup'), (N'SLEEP_DBSTARTUP', 'startup'),
    (N'SLEEP_DCOMSTARTUP', 'startup'), (N'SLEEP_MASTERDBREADY', 'startup'),
    (N'SLEEP_MASTERMDREADY', 'startup'), (N'SLEEP_MASTERUPGRADED', 'startup'),
    (N'SLEEP_MSDBSTARTUP', 'startup'), (N'SLEEP_PHYSMASTERDBREADY', 'startup'),
    (N'SLEEP_SYSTEMTASK', 'startup'), (N'SLEEP_TEMPDBSTARTUP', 'startup'),
    (N'STARTUP_DEPENDENCY_MANAGER', 'startup'), (N'WAITFOR', 'waitfor'),
    (N'WAITFOR_TASKSHUTDOWN', 'waitfor'), (N'WAIT_FOR_RESULTS', 'waitfor'),
    (N'BROKER_EVENTHANDLER', 'broker'), (N'BROKER_TASK_STOP', 'broker'),
    (N'BROKER_TO_FLUSH', 'broker'), (N'BROKER_TRANSMITTER', 'broker'), (N'DBMIRRORING_CMD', 'ag'),
    (N'DBMIRROR_DBM_EVENT', 'ag'), (N'DBMIRROR_DBM_MUTEX', 'ag'), (N'DBMIRROR_EVENTS_QUEUE', 'ag'),
    (N'DBMIRROR_WORKER_QUEUE', 'ag'), (N'HADR_CLUSAPI_CALL', 'ag'),
    (N'HADR_FILESTREAM_IOMGR_IOCOMPLETION', 'ag'), (N'HADR_LOGCAPTURE_WAIT', 'ag'),
    (N'HADR_NOTIFICATION_DEQUEUE', 'ag'), (N'HADR_TIMER_TASK', 'ag'), (N'HADR_WORK_QUEUE', 'ag'),
    (N'PARALLEL_REDO_DRAIN_WORKER', 'ag'), (N'PARALLEL_REDO_LOG_CACHE', 'ag'),
    (N'PARALLEL_REDO_TRAN_LIST', 'ag'), (N'PARALLEL_REDO_WORKER_SYNC', 'ag'),
    (N'PARALLEL_REDO_WORKER_WAIT_WORK', 'ag'), (N'PREEMPTIVE_HADR_LEASE_MECHANISM', 'ag'),
    (N'REDO_THREAD_PENDING_WORK', 'ag'), (N'PREEMPTIVE_XE_CALLBACKEXECUTE', 'trace'),
    (N'PREEMPTIVE_XE_DISPATCHER', 'trace'), (N'PREEMPTIVE_XE_GETTARGETSTATE', 'trace'),
    (N'PREEMPTIVE_XE_SESSIONCOMMIT', 'trace'), (N'PREEMPTIVE_XE_TARGETFINALIZE', 'trace'),
    (N'PREEMPTIVE_XE_TARGETINIT', 'trace'), (N'SQLTRACE_BUFFER_FLUSH', 'trace'),
    (N'SQLTRACE_INCREMENTAL_FLUSH_SLEEP', 'trace'), (N'SQLTRACE_WAIT_ENTRIES', 'trace'),
    (N'XE_BUFFERMGR_ALLPROCESSED_EVENT', 'trace'), (N'XE_DISPATCHER_JOIN', 'trace'),
    (N'XE_DISPATCHER_WAIT', 'trace'), (N'XE_LIVE_TARGET_TVF', 'trace'),
    (N'XE_TIMER_EVENT', 'trace'), (N'QDS_ASYNC_QUEUE', 'qstore'),
    (N'QDS_CLEANUP_STALE_QUERIES_TASK_MAIN_LOOP_SLEEP', 'qstore'),
    (N'QDS_PERSIST_TASK_MAIN_LOOP_SLEEP', 'qstore'), (N'QDS_SHUTDOWN_QUEUE', 'qstore'),
    (N'FT_IFTSHC_MUTEX', 'fulltext'), (N'FT_IFTSISM_MUTEX', 'fulltext'),
    (N'FT_IFTS_SCHEDULER_IDLE_WAIT', 'fulltext'), (N'WAIT_XTP_CKPT_CLOSE', 'xtp'),
    (N'WAIT_XTP_HOST_WAIT', 'xtp'), (N'WAIT_XTP_OFFLINE_CKPT_NEW_LOG', 'xtp'),
    (N'WAIT_XTP_RECOVERY', 'xtp'), (N'CLR_AUTO_EVENT', 'clr'),
    (N'AZURE_IMDS_VERSIONS', 'internal'), (N'POPULATE_LOCK_ORDINALS', 'internal'),
    (N'PVS_PREALLOCATE', 'internal'), (N'PWAIT_DIRECTLOGCONSUMER_GETNEXT', 'internal'),
    (N'PWAIT_EXTENSIBILITY_CLEANUP_TASK', 'internal'), (N'SOS_WORKER_MIGRATION', 'internal');
-- Two photos of the clipboard go into one table: photo 1 before, photo 2 after
DROP TABLE IF EXISTS #photo;
CREATE TABLE #photo (photo tinyint NOT NULL,
    wait_type nvarchar(60) COLLATE DATABASE_DEFAULT NOT NULL,
    times_waited bigint NOT NULL, waited_ms bigint NOT NULL, signal_ms bigint NOT NULL);
INSERT #photo (photo, wait_type, times_waited, waited_ms, signal_ms)
SELECT 1, wait_type, waiting_tasks_count, wait_time_ms, signal_wait_time_ms
FROM sys.dm_os_wait_stats;
-- Change the delay to the length of your window (hh:mm:ss)
WAITFOR DELAY '00:01:00';
INSERT #photo (photo, wait_type, times_waited, waited_ms, signal_ms)
SELECT 2, wait_type, waiting_tasks_count, wait_time_ms, signal_wait_time_ms
FROM sys.dm_os_wait_stats;
-- A counter that went down means someone cleared the stats: stop and discard the run
IF EXISTS (SELECT 1
           FROM #photo AS p1
           JOIN #photo AS p2
               ON p2.wait_type = p1.wait_type AND p2.photo = 2
           WHERE p1.photo = 1
             AND (p2.times_waited < p1.times_waited
                  OR p2.waited_ms < p1.waited_ms
                  OR p2.signal_ms < p1.signal_ms))
    THROW 50001, N'The wait stats were cleared during the window. Run the script again.', 1;
-- Photo 2 minus photo 1, for every real wait that grew in the window
SELECT TOP (15)
       d.wait_type,
       CAST(d.waited_ms / 1000.0 AS decimal(18, 1)) AS waited_sec,
       CAST(100.0 * d.waited_ms
            / NULLIF(SUM(d.waited_ms) OVER (), 0) AS decimal(5, 1)) AS share_pct,
       d.times_waited,
       CAST(1.0 * d.waited_ms / NULLIF(d.times_waited, 0) AS decimal(18, 1)) AS avg_wait_ms,
       CAST(100.0 * d.signal_ms / NULLIF(d.waited_ms, 0) AS decimal(5, 1)) AS signal_pct
FROM (SELECT w.wait_type,
             SUM(IIF(w.photo = 2, w.times_waited, -w.times_waited)) AS times_waited,
             SUM(IIF(w.photo = 2, w.waited_ms, -w.waited_ms)) AS waited_ms,
             SUM(IIF(w.photo = 2, w.signal_ms, -w.signal_ms)) AS signal_ms
      FROM #photo AS w
      WHERE NOT EXISTS (SELECT 1 FROM @harmless AS h WHERE h.wait_type = w.wait_type COLLATE DATABASE_DEFAULT)
      GROUP BY w.wait_type) AS d
WHERE d.waited_ms > 0
ORDER BY d.waited_ms DESC;
Here’s one quiet minute on my idle test server. Only three waits grew, and none reached a tenth of a second. The share_pct column still adds up to 100, so read waited_sec next to it before you worry.
Change ’00:01:00′ to the length you want, in hours, minutes and seconds, up to 24 hours. For longer baselines, save snapshots to a table instead. In the result, share_pct shows which waits owned the window. Compare that top row with the top row of the since-restart list. When they differ, the window is the one to believe.
Fix It
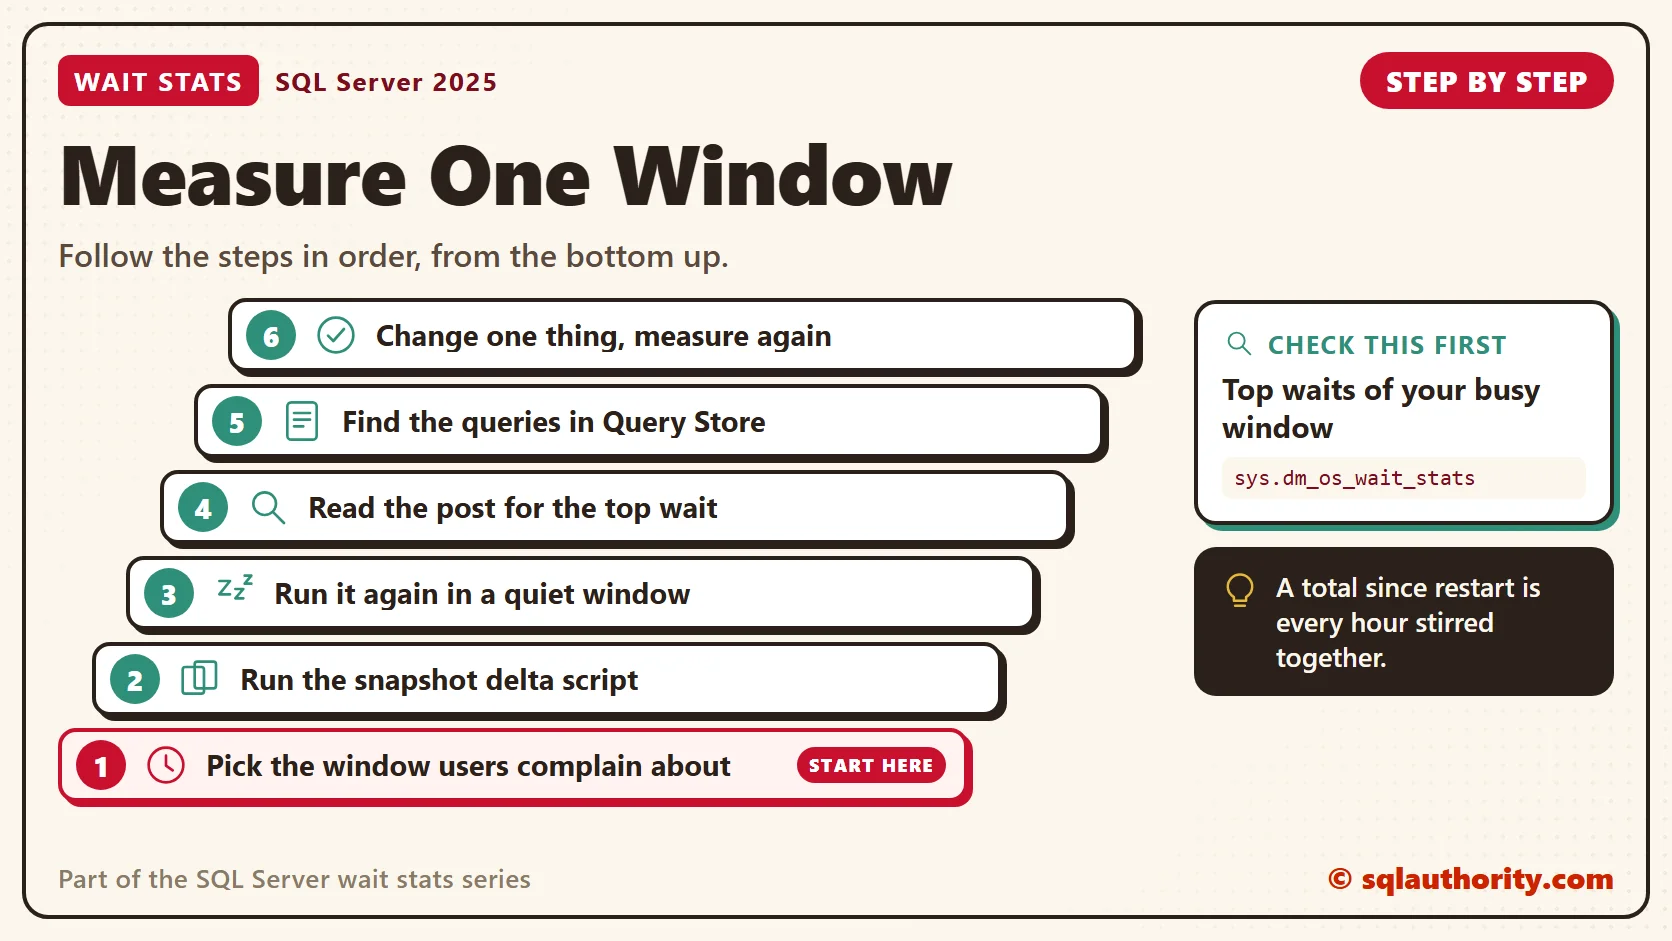
This is a method more than a fix. Here’s the order I use it in.
- Pick the window your users complain about.
- Run the delta script with the delay set to that window.
- Run it again in a quiet window, so you know what normal looks like.
- Take the top wait of the busy window and read its post in this series.
- Find the queries behind that wait in Query Store.
- Change one thing, then measure the same window again.
New in SQL Server 2022 and 2025
The snapshot method hasn’t changed, and SQL Server 2025 doesn’t change it. Subtraction still works the way it always has.
What changed is the next step. Since SQL Server 2022, Query Store is on by default for new databases. So when your delta names a wait, the per-query waits for new databases are already being recorded. Databases moved from older versions keep their own Query Store setting, so check those.
Related Reading
- DMV Snapshot Deltas for a Query Activity Interval
- Comparing Two Wait Stats Snapshots to See What Changed
- Query Store Wait Stats: Why a Query Was Slow, Not Just That It Was
- Wait Statistics from Query Execution Plan
The Clipboard Diner, a wait stats series. Previous: Live Wait Stats: What Is Waiting Right Now. Next: CXPACKET Wait Stats: What Parallel Waits Mean. Every post is listed in the series guide.
Tomorrow is Monday, and Monday brings the tour bus: forty orders that arrive as one party.
A total since restart is not your busy hour, it is every hour stirred together.
Published by Pinal Dave on SQLAuthority. More of my work at pinaldave.com.
Discover more from SQL Authority with Pinal Dave
Subscribe to get the latest posts sent to your email.