

SQL Server network latency can make a fast database look slow. An application that fetches 4,000 orders one query at a time pays for every round trip. I measured the loop against one query, tested what ASYNC_NETWORK_IO means, and show how to check your own round trip time.

Database Performance Health Check: Six Months Slow, Fixed in 75 Minutes
Six months of slow SQL, fixed in 75 minutes. See what a database performance health check finds, and how one focused 4-hour session ends the guessing.
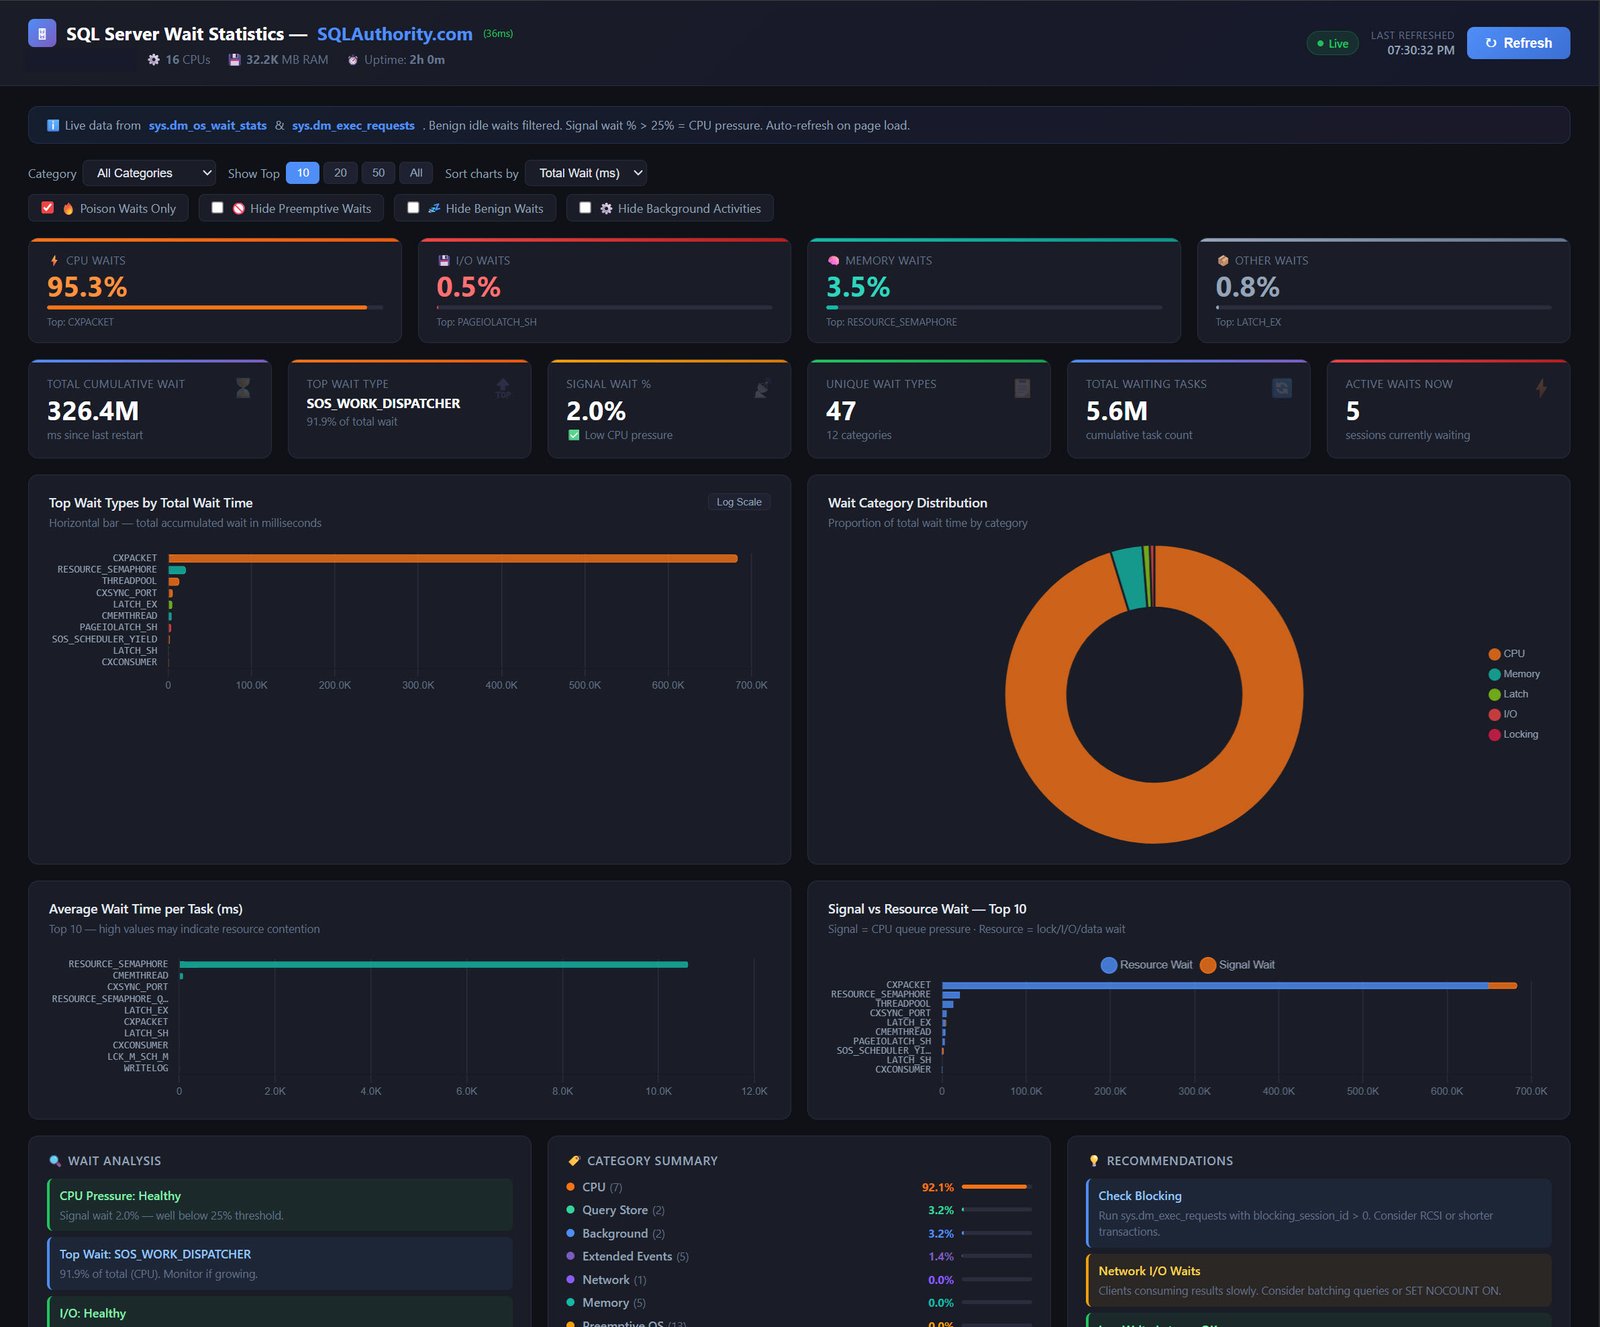
AI Built SQL Server Wait Statistics Dashboard in Minutes
One prompt. Twelve lines of plain English. A complete, production-quality, dark-themed SQL Server Wait Statistics Dashboard. And a feeling I am still not sure how to name.

SQL SERVER Performance: When MAXDOP = 1 Slowed Down the Entire Business
Slow reports, slow transactions, and the internal team could not find why. In this case study, MAXDOP = 1 was quietly slowing down the entire business.

SQL SERVER – Thread Pool Waits: Monitoring and Optimization
Thread pool waits management plays a vital role in maximizing the utilization of threads and ensuring the smooth execution of tasks.

Query Store Wait Stats: Why a Query Was Slow, Not Just That It Was
Read Query Store wait stats by query, plan, interval, and category, then compare matched windows with execution counts and capture coverage.

Chatty Applications: Finding Many Tiny Queries per Second
Diagnose chatty applications with batch rates, cached executions, bounded session event counts, and measured round trips per user action.