
SOS_SCHEDULER_YIELD wait stats count the moments a query gives up the CPU after its turn and waits for it again. A little of it is normal on any busy server. A lot of it, with a line of tasks behind it, means your queries want more CPU than you have.

This post is part of my wait stats series, told as one story at the Clipboard Diner. Every post is listed in the series guide.
Night 8 at the Clipboard Diner
After the house rules worked on Tuesday, Casey expected a quiet Wednesday. The kitchen has one more rule, older than the door sign. Each cook gets a short turn at a burner, timed by a little sand timer. When the sand runs out, the cook glances at the rail.
If a ticket is waiting, the cook steps back and lets it in. If the rail is empty, the cook flips the timer and keeps going. It’s a fair rule. Nobody hogs a burner while a hungry trucker waits.
Tonight the rule turned the line into a square dance. Ace stepped in, Kit stepped out, Jesse stepped in, and Jules stepped out. The sand timers never stopped flipping. Casey checked every ticket on the rail. Nobody was waiting for potatoes, and nothing needed the basement. Every ticket had all it needed except a burner.
Then Casey watched Jesse work a grilled cheese. The sandwich needed four slices of cheese. To find them, Jesse flipped through the whole tray at the burner, all two hundred slices. Kit was doing the same with the tomatoes. The burners weren’t too few. The work on them was too big.
The clipboard line that night was plain: Nobody waited for potatoes. Everybody waited for a burner.
What SOS_SCHEDULER_YIELD Means
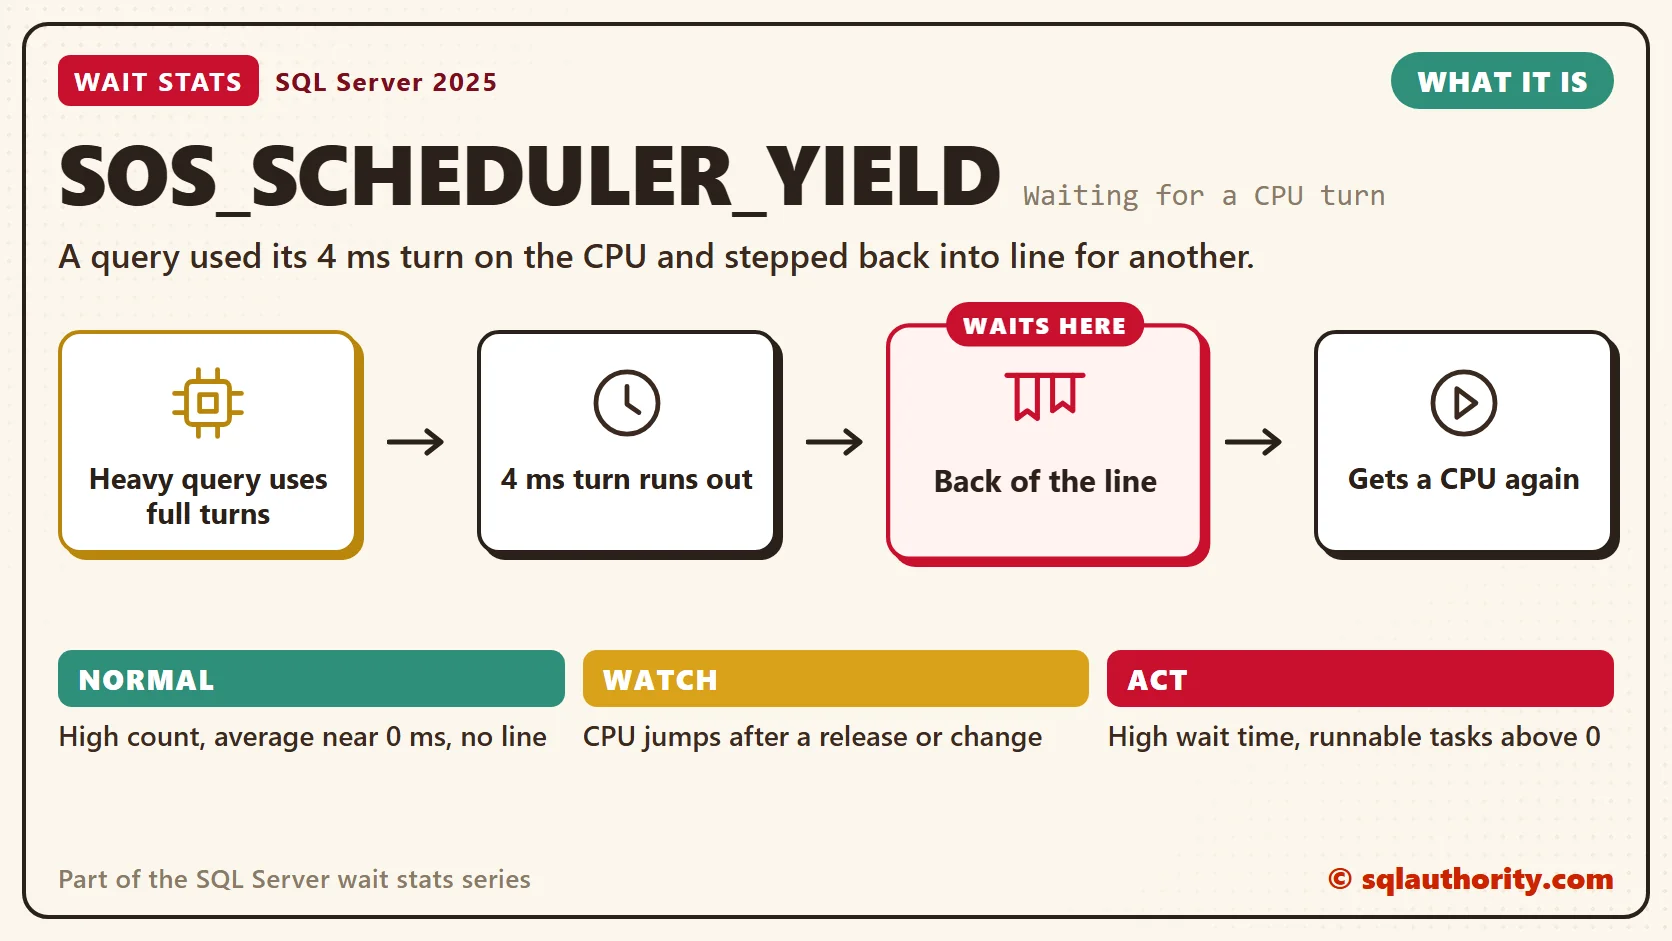
That sand timer is how SQL Server shares a CPU. Each scheduler runs one worker at a time, and workers take turns by agreement. A worker runs until it has to wait for something, or until its turn, called a quantum, runs out. The quantum is 4 milliseconds.
When the quantum runs out, the worker yields on its own. If other tasks are waiting for that scheduler, it goes to the back of the line. The time it spends in that line is recorded as SOS_SCHEDULER_YIELD.
This wait needs no resource. The task isn’t waiting for a page, a lock or memory. It only waits for the CPU, so almost all of its wait time is signal wait. If that term is new, read Signal Wait Stats first.
One detail makes this wait easy to misread. When nobody else is waiting, the worker yields and gets the CPU back at once. The wait still counts, but with almost no time. So a huge count with a tiny average means busy CPUs and no line. That’s Jesse flipping the timer with an empty rail.
Normal or a Problem?
| Situation | What it means | What to do |
|---|---|---|
| High count, average wait near 0 ms, runnable tasks near 0 | Busy CPUs, no line. | Normal. Leave it. |
| High total wait time and runnable tasks above 0 for long stretches | Tasks queue for CPU. | Find the top CPU queries below. |
| CPU jumped after a release or a plan change | A plan got worse. | Compare plans in Query Store and force the good one. |
| It rides along with heavy parallel waits | Too many threads compete for the same CPUs. | Check Parallelism Wait Stats. |
See It on Your Server
The first query reads the yield wait and the line at each scheduler. Run it during your busiest hour, a few times in a row.
-- The yield wait since the last restart
SELECT wait_type,
       waiting_tasks_count,
       wait_time_ms,
       signal_wait_time_ms,
       CAST(1.0 * wait_time_ms / NULLIF(waiting_tasks_count, 0) AS decimal(18, 2)) AS avg_wait_ms
FROM sys.dm_os_wait_stats
WHERE wait_type = N'SOS_SCHEDULER_YIELD';

-- The line of tasks at each scheduler right now
SELECT scheduler_id,
       current_tasks_count,
       runnable_tasks_count,
       active_workers_count,
       work_queue_count
FROM sys.dm_os_schedulers
WHERE status = N'VISIBLE ONLINE';
Look at avg_wait_ms and runnable_tasks_count together. A tiny average with no line is a busy kitchen doing fine. A steady line on most schedulers is real CPU pressure, and the queries below are where it comes from.
The second query lists the statements that used the most CPU since their plans were cached. CPU time in this view is in microseconds, so the query divides by 1,000.
-- Which statements used the most CPU since their plans were cached?
SELECT TOP (10)
       qs.total_worker_time / 1000 AS cpu_ms_total,
       qs.execution_count AS runs,
       CAST(qs.total_worker_time / 1000.0 / NULLIF(qs.execution_count, 0) AS decimal(18, 2)) AS cpu_ms_per_run,
       qs.total_logical_reads AS pages_read,
       st.statement_text
FROM sys.dm_exec_query_stats AS qs
CROSS APPLY sys.dm_exec_sql_text(qs.sql_handle) AS t
CROSS APPLY (SELECT SUBSTRING(t.text, qs.statement_start_offset / 2 + 1,
                 (IIF(qs.statement_end_offset = -1, DATALENGTH(t.text), qs.statement_end_offset)
                  - qs.statement_start_offset) / 2 + 1) AS statement_text) AS st
ORDER BY qs.total_worker_time DESC;
Read cpu_ms_total and runs together. One heavy query and one tiny query that runs a million times can both top this list. Check pages_read too. It counts pages read from memory, and a statement that reads millions of them is Jesse flipping through the cheese.
Fix It
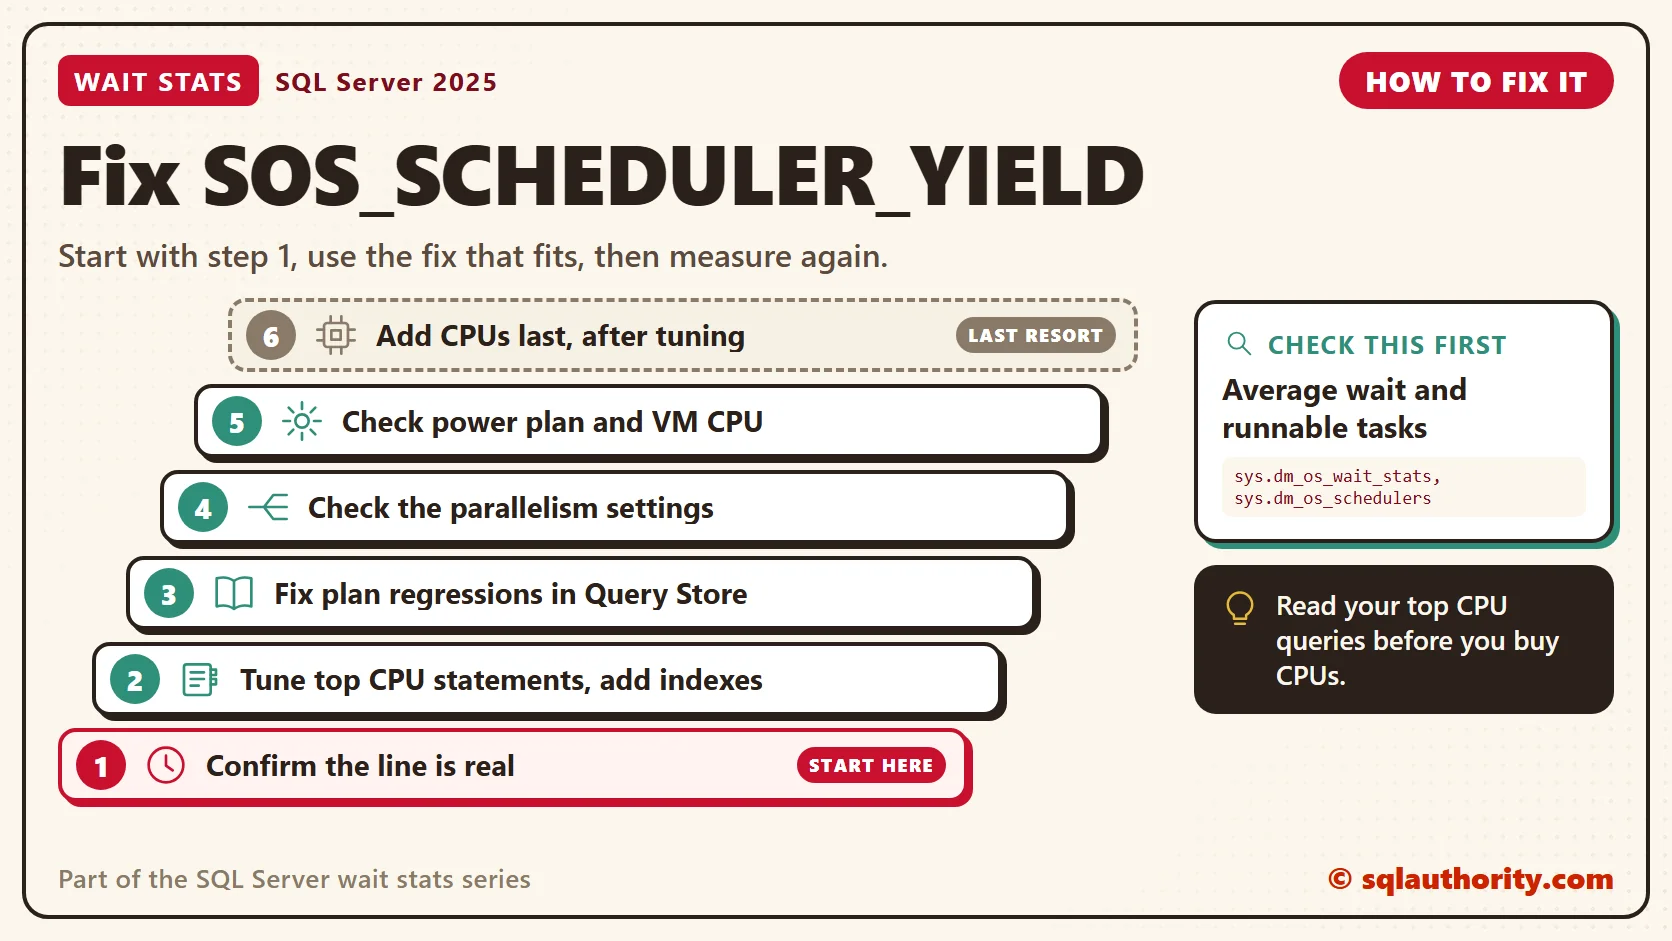
- Confirm the line is real. Measure a busy window and watch runnable tasks, as in Wait Stats Over Time.
- Tune the top three CPU statements. Add indexes that turn scans into seeks, and remove implicit conversions.
- Look for plan regressions in Query Store, and force the last good plan while you fix the cause.
- Check the parallelism settings, so small queries stop grabbing extra threads.
- Check the Windows power plan and the VM’s CPU allocation. A slowed CPU looks like a busy one.
- Add CPUs last, after the queries are tuned.
You could say more CPU is cheaper than a week of tuning. Sometimes it is. But most SQL Server licenses are sold per core. Then every new core costs twice: once for the hardware and once for the license.
Buying cores before anyone reads the queries is the expensive version of this mistake. The new server feels fast for a month. Then the same few queries fill it up again, and you tune them anyway.
New in SQL Server 2022 and 2025
Nothing changed in what this wait means. The quantum is still 4 ms, and the line still forms the same way. What changed is how easy it is to find the cause.
Since SQL Server 2022, Query Store is on by default for new databases. CPU history per query is there when you need it. Parameter Sensitive Plan optimization arrived at compatibility level 160. It keeps more than one plan when the best plan depends on the parameter. That cuts some CPU spikes from bad plan reuse. In SQL Server 2025 Enterprise and Enterprise Developer editions, DOP feedback is on by default and trims wasted parallel threads. It needs compatibility level 160 or higher and Query Store in READ_WRITE mode.
Related Reading
- Detecting CPU Pressure with Wait Statistics
- Signal Waits: Telling CPU Pressure From Slow Disks
- CPU Scheduler Waiting On Disk
The Clipboard Diner, a wait stats series. Previous: Parallelism Wait Stats: Tuning MAXDOP and Cost Threshold. Next: PAGEIOLATCH Wait Stats: Waiting for Data From Disk. Every post is listed in the series guide.
Next, the prep counter runs out of room, and the basement stairs get busy.
SOS_SCHEDULER_YIELD is not a call to buy CPUs, it is a call to read your top CPU queries.
Published by Pinal Dave on SQLAuthority. More of my work at pinaldave.com.
Discover more from SQL Authority with Pinal Dave
Subscribe to get the latest posts sent to your email.




17 Comments. Leave new
I’ve often observed SOS_SCHEDULER_YIELD as “last_wait_type” instead of “wait_type”, where a unique session is consuming 100% of 1 cpu for hours (due to stale stats incurring nested loops between huge tables).
In this situation (no IO, lock, latch, network nor any other waits), SOS_SCHEDULER_YIELD is the only event waited on, which means… no wait all all, am I right ?
I had this wait recently on one of our systems. Clients were reporting slow responses from the server. Doing a DBCC freeproccache and a DBCC freesystemcache fixed the issue.
You basically cleared the cache from your system. Most likely there must be a bad execution plan which occasionally works good for few values out of the sproc, could also be issue of parameter sniffing.
I have same issue in production while running SSI sin for each loop which query million of rows. I am seeing this king of wait in “last wait type” session is showing Insert as running ststement but count in table is 0. As soon i as I kill session everthing start working as it should….Please suggest.
I have situation:
SP work good from query, but not work from Excel (sos_scheduler_yield).
I FOUND RESOLUTION !!!!!!!!!!!!!!!!!!!!!!!!!!!!!!!!!!!!!!!!!!!!!!!!!!!!!!!!!!!!!!!!!!!!!!!!!!!!!
–> Just ReCreate this SP.
But, I can’t explain this? Pinal?
For explanation – check online for parameter sniffing …
If that is the case, recompile would also work and also DBCC FREEPROCCACHE
I had the same situation and just fixed the issue by dropping and recreating the sp. what was behind ?
I had the same issue, and fixed by drop and create the sp
how this can be explained ?
Instead of dropping the procedure or blowing away the cache, you could first try exec sp_recompile [storedProcedureName]; to recompile the execution plan. Sounds like a potential parameter sniffing matter on your proc or change in statistics for your table when a better plan could be reached. Overall, sounds like a bad execution plan.
Excessive CPU use may be the reason of Spinning and backoff..
Is there a way to find out on which database was the expensive query executed on when 1 SQL Server instance is serving multiple user databases?
have you looked into sys.dm_exec_query_stats
Yes. I think the only way to pull out the database name on which the query has been execute is to do an inner join with sys.dm_exec_requests on session_id. But then it will only return the data when the SQL statement is executing.
Not sure how to relate the high intensive queries with the databases when the queries have already completed execution.
Until unless we know the database for which the queries have been executed, those heavy queries cannot be worked upon or further tuned to reduce the CPU utilization.
hello ,
whenever i run select * from sys.sysprocessess for the same spid which i am running this query is having lastwait type as ASYNC_NETWORK_IO , is this a problem please suggest
thanks in advance
You have to look at wait time along with wait type. I am guessing that this query is fetching large number of rows so it would be normal.
Dear Pinal,
Have a question on Scheduler. In my case first 4 schedulers are having runnable task(sometimes double digit),But last 4 scheduler always be 0
Why? Does it mean only 4 schedulers are being used? and rest are idle.