
PAGEIOLATCH wait stats measure the time queries wait while data pages are read from disk into memory. Every server has some. When they lead your wait list, either your queries read too much or your storage reads too slowly.

This post is part of my wait stats series, told as one story at the Clipboard Diner. Every post is listed in the series guide.
Night 9 at the Clipboard Diner
Casey spent the morning sorting the cheese tray, and Wednesday’s square dance never came back. Thursday night brought a new trouble instead. The stuffed pepper special needs fourteen ingredients, and the prep counter holds about half of them.
So every few minutes a cook hollered for something from the basement. The dishwasher ran down the steep stairs into the walk-in cooler, felt around in the cold, and climbed back up. The ticket sat on the spike the whole time. The cook waited with it.
Casey kept tally on the chalkboard by the stairs. By 8 PM there were thirty-one marks. Then Casey looked at what came up. One trip was a whole crate of lettuce, because Jules wanted a single leaf for a garnish. The crate took over the counter and pushed the salsa off the end. Twenty minutes later, someone sent for salsa.
The stairs were slow too. The bulb over them had burned out on Tuesday, and nobody had replaced it. The dishwasher was finding the cooler door by memory.
At closing, the clipboard got the count: 31 trips downstairs. Half for things we didn’t need.
What PAGEIOLATCH Means
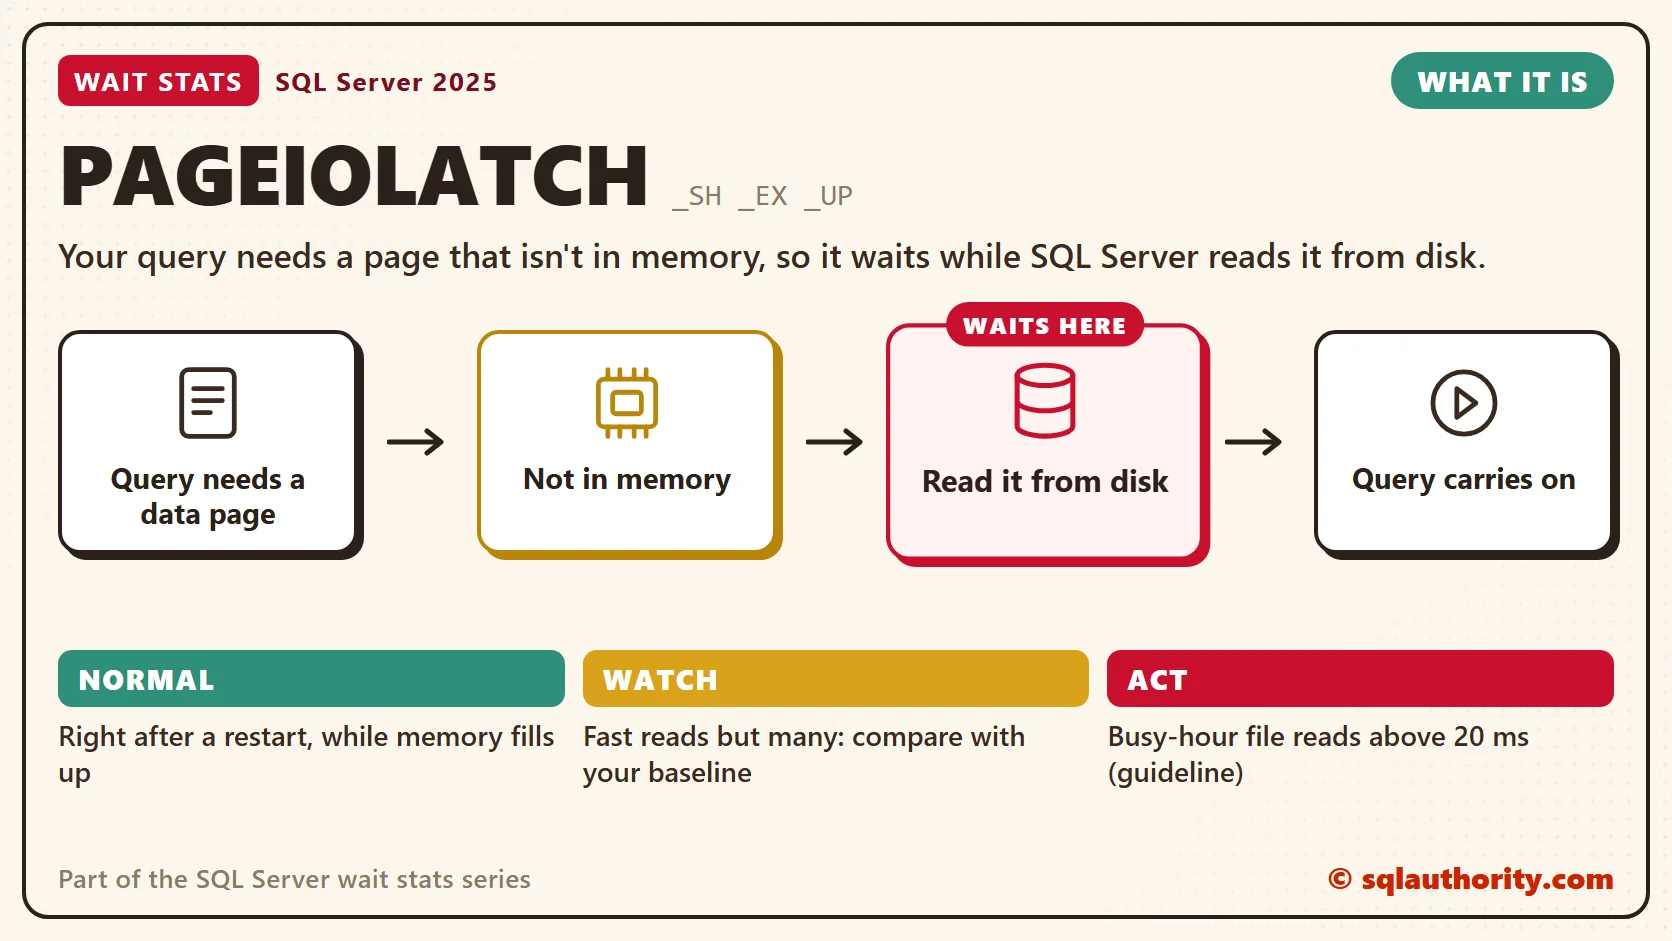
That basement is your data files. The prep counter is the buffer pool, SQL Server’s cache of data pages in memory. A query reads every row from a page in memory. When the page it needs isn’t there, SQL Server reads it from disk first. The query waits until the page arrives.
During that read, SQL Server holds a latch on the page’s spot in memory. A latch is a short internal lock that protects a page in memory while it’s read in or changed. The wait for that read is PAGEIOLATCH, and the ending names the latch mode the task asked for:
- PAGEIOLATCH_SH: shared mode. The query wants to read the page. This is the one you’ll see most.
- PAGEIOLATCH_EX: exclusive mode, while the page has I/O in flight. A task that will change the page waits here, and so does one behind a page being written to disk.
- PAGEIOLATCH_UP: update mode. Less common, and you’ll see it mostly on allocation and system pages.
This family covers data pages only. Log writes wait on WRITELOG. Other disk work, like sorts that spill, shows up as IO_COMPLETION, which is tomorrow’s wait.
Two Causes, One Wait
The wait looks the same for both causes, so you have to tell them apart. Too many reads is the lettuce crate. A scan reads a whole table to find a few rows, and it pushes useful pages out of memory. Later queries then read those pages again.
Slow storage is the dark stairway. Every read takes too long, no matter how few you make. Memory sits in the middle of both. A bigger counter means fewer trips, but a scan of a huge table will fill any counter you buy.
It’s easy to blame storage for every PAGEIOLATCH wait. Then a storage admin shows you disks that are mostly idle, serving one scan over and over. That’s why I check the queries first.
Normal or a Problem?
| Situation | What it means | What to do |
|---|---|---|
| PAGEIOLATCH_SH right after a restart | The cache is warming up. | Normal. Measure again after a busy day. |
| High count, low average wait | Reads are fast. Compare the volume with your baseline. | If users feel it, find the top-read queries and fix the scans. |
| High average wait and slow file latency | Storage answers slowly. | Take the per-file numbers to your storage team. |
| One file is much slower than the rest | One volume is overloaded. | Spread the busy files, or move that one. |
| PAGEIOLATCH_EX during big updates or loads | Pages are read in to be changed. | Index the update’s WHERE clause and work in smaller batches. |
See It on Your Server
The first query reads the PAGEIOLATCH family from the clipboard, with the average time per wait. That isn’t disk latency. The second query measures latency per file.
-- PAGEIOLATCH waits since the last restart
SELECT wait_type,
       waiting_tasks_count,
       wait_time_ms,
       CAST(1.0 * wait_time_ms / NULLIF(waiting_tasks_count, 0) AS decimal(18, 2)) AS avg_wait_ms
FROM sys.dm_os_wait_stats
WHERE wait_type LIKE N'PAGEIOLATCH%'
ORDER BY wait_time_ms DESC;
A high count with a low average means fast reads. Check whether the volume is above your normal workload. A high average points to slow storage. Both totals cover the time since the last restart. Measure a busy window with Wait Stats Over Time before you decide.
The second query shows read and write latency for every database file. The average read latency is the read stall time divided by the number of reads. A file with no reads yet shows an empty average, not a zero. The list is sorted by total read stall, so the files that cost queries the most time come first.
-- Which database files cost the most read waiting, and how long does one read take?
SELECT DB_NAME(f.database_id) AS database_name,
       m.name AS file_name,
       m.type_desc AS file_type,
       f.num_of_reads AS reads_done,
       CAST(1.0 * f.io_stall_read_ms / NULLIF(f.num_of_reads, 0) AS decimal(10, 1)) AS avg_read_ms,
       f.num_of_writes AS writes_done,
       CAST(1.0 * f.io_stall_write_ms / NULLIF(f.num_of_writes, 0) AS decimal(10, 1)) AS avg_write_ms,
       m.physical_name
FROM sys.dm_io_virtual_file_stats(NULL, NULL) AS f
JOIN sys.master_files AS m
    ON m.database_id = f.database_id
   AND m.file_id = f.file_id
ORDER BY f.io_stall_read_ms DESC;
Look at the ROWS files at the top of the list. On modern SSD storage I expect data file reads in single-digit milliseconds. When busy-hour reads average above 20 ms, I start asking storage questions. These are my working numbers, not a law.
Fix It
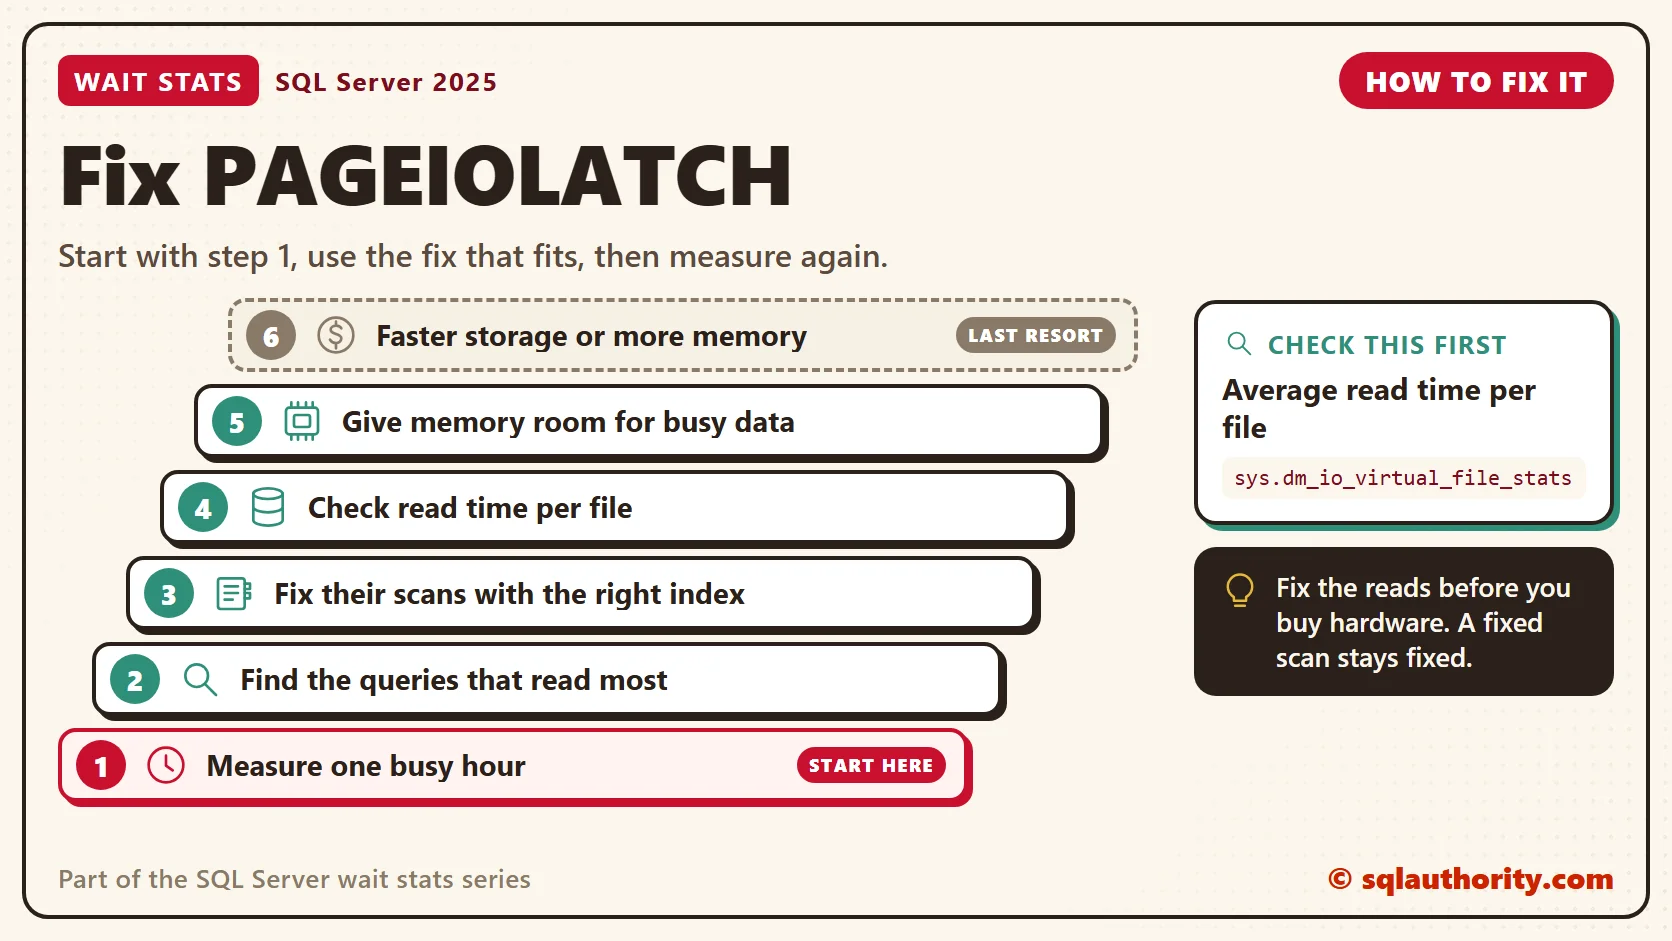
- Measure a busy window, so a restart or a nightly job doesn’t fool you.
- Find the queries with the most logical reads. Use the top CPU query from SOS_SCHEDULER_YIELD Wait Stats, ordered by total_logical_reads.
- Fix their scans: add the missing index, update statistics, and select only the columns you need.
- Check file latency per file. If one volume is slow, show your storage team those numbers.
- Check that max server memory leaves the buffer pool enough room for your busy data.
- Upgrade storage or add memory last, once the reads are lean.
You could say memory is cheap now, so add more and the waits go away. Fair point, more memory hides a lot of reads. But it hides them only until the table grows. A fixed scan stays fixed.
New in SQL Server 2022 and 2025
Nothing new changes what PAGEIOLATCH means. A page still has to come from disk before a query can use it. What still matters is the old work: lean reads, healthy storage and enough memory. Since SQL Server 2022, Query Store is on by default for new databases. That makes the top-read queries easier to find.
Related Reading
- PAGEIOLATCH_SH Waits: Slow Storage or Too Many Reads
- How to Optimize Your Server Performance by Reducing IO Waits
- Script: Current IO Related Waits on SQL Server
The Clipboard Diner, a wait stats series. Previous: SOS_SCHEDULER_YIELD Wait Stats: Reading CPU Pressure. Next: IO_COMPLETION Wait Stats: Spills, Sorts and File Growth. Every post is listed in the series guide.
Something much bigger than lettuce goes down the basement stairs next: half a sheet cake.
PAGEIOLATCH is not proof of a slow disk, it is a reason to check what the queries read.
Published by Pinal Dave on SQLAuthority. More of my work at pinaldave.com.
Discover more from SQL Authority with Pinal Dave
Subscribe to get the latest posts sent to your email.



10 Comments. Leave new
I’ve found this article good when trying to determine if there’s I/O problems with the server, be it Sql Server or any other server.
https://docs.microsoft.com/en-us/previous-versions/sql/sql-server-2005/administrator/cc966540(v=technet.10)
If you scroll down to where it says I/O Bottlenecks you’ll see list of 6 items in it. I think that’s a good starting point. Fire up Performance Monitor and monitor your disks while Sql Server is under load.
“If your disk queue length frequently exceeds a value of 2 during peak usage of SQL Server, then you might have an I/O bottleneck.”
One of our server had queue length 10-18 during peak usage. That was enough for me to announce that we are having I/O problems ;)
-Marko
I would additionally adhere to the point of proper placing of files by adding and the factor of file and page contention. In my practise I have seen for example tempdb which under heavy file contention is making SQL Server unresponsive and slow. So I would add to that point and considering splitting a database to different files (this is especially valid for tempdb, where there is an official reccomendation from Microsoft why to do so)
How would you split MDF, LDF or tables to different separate disk(s) in a SAN environment?
Tip: By all means the Disk I/O & Memory are key indicators to cause the performance issues where the wait types will highlight the cause, so keeping a close watch on these factors will help to reduce the problem and then jump into QUERY tuning.
I was having problems and this article was very helpful.
What do you mean by “Consistent higher value, Benchmark” under your second point under memory related counters? How do I know what is the benchmark?
SQLServer: Memory ManagerMemory Grants Outstanding (Consistent higher value, Benchmark)
Thank you!
TimB
Hi Pinal,
I use the third party backup tool to take compressed backups and the backup is transferred to some backup server through FTP tasks scheduled in windows tasks. when monitored with Memory : Page Faults/Sec in perfmon i have observed that the counter value is near 80-100 when backup occur and while transfer it is 100 consistently. Normally the value fluctuates between 40-100.
My server is configured with 49136MB page file,32GB ram and 8 logical CPU.
CPU utilization is near 75-95% Any suggestions to reduce the page faults/sec count would be much helpful
I have also found PageIOLatch_SH wait type in my long running queries. I checked perfmon and found that in avg.DiskQueLength counter avg value is 10 – 14. Is that because of I/O bottlenecks. If yes then which hardware need to be update?
What I liked most about this post is the start – it’s the absolute truth, and nothing but the truth!
We use virtualiazation in our development & QA environments. Once, we restored a database of around 50GB, and our servers simply stopped processing our queries. The nightly jobs ran for 3 days and the application ended up in timeouts. We looked at the wait stats and came across not one, but two PAGEIOLATCH stats – PAGEIOLATCH_EX and PAGEIOLATCH_SH.
We informed our IT, and instead of looking at our data, they increased the processor and memory allocations. Their reasoning – they have the best of the line hardware, and no application should require to use more!!!!
When that did not fix it and we escalated matters, they deployed complex monitoring, and guess what? – we got a brand new IO subsystem for our Virtual Machines within 2 weeks!
Dave, it seems almost every SQL search I type into Google, it brings me to you. Thank you for all your sharing. It has helped me countless times.
I thought >15-20 millisecond is not good!!!!!!!!!!!!
Checking Disk Related Perfmon Counters
Average Disk sec/Read (Consistent higher value than 4-8 millisecond is not good)
Average Disk sec/Write (Consistent higher value than 4-8 millisecond is not good)