
CXPACKET wait stats show the time parallel query threads spend waiting on each other as they pass rows. They’re a sign of teamwork, not a bug. The real question is whether the work was split fairly.

This post is part of my wait stats series, told as one story at the Clipboard Diner. Every post is listed in the series guide.
Night 6 at the Clipboard Diner
Last night’s two photos showed Casey that the dinner hour had its own story. Tonight the story arrived on wheels. At 6:10 PM the Monday tour bus crunched into the gravel lot. Forty leaf-peepers from two counties over filed in at once.
One cook would need over an hour for forty orders. So Dee did what Dee always does with a big party. Dee split the tickets by dish and handed each cook a stack. Ace got the veggie burgers, Kit the hash browns, Jules the waffles, and Jesse the blueberry pancakes.
The veggie burgers came fast, so fast that the pass shelf filled up. For a minute Ace stood holding two hot plates with nowhere to set them, until Dee cleared a spot. Then the veggie burgers were done. Kit and Jules finished soon after and started wiping down their stations.
Jesse did not finish. Twenty-two of the forty had ordered the blueberry pancakes. Dee stood at the pass with eighteen plates ready and a long gap in the middle. A spatula tapped on the steel.
The bus ate in twenty-six minutes. One cook alone would have needed seventy. Casey didn’t call that a failure, but Casey saw where the minutes went. The clipboard got one line: Bus: 26 min. 11 of it waiting on pancakes.
What CXPACKET Means
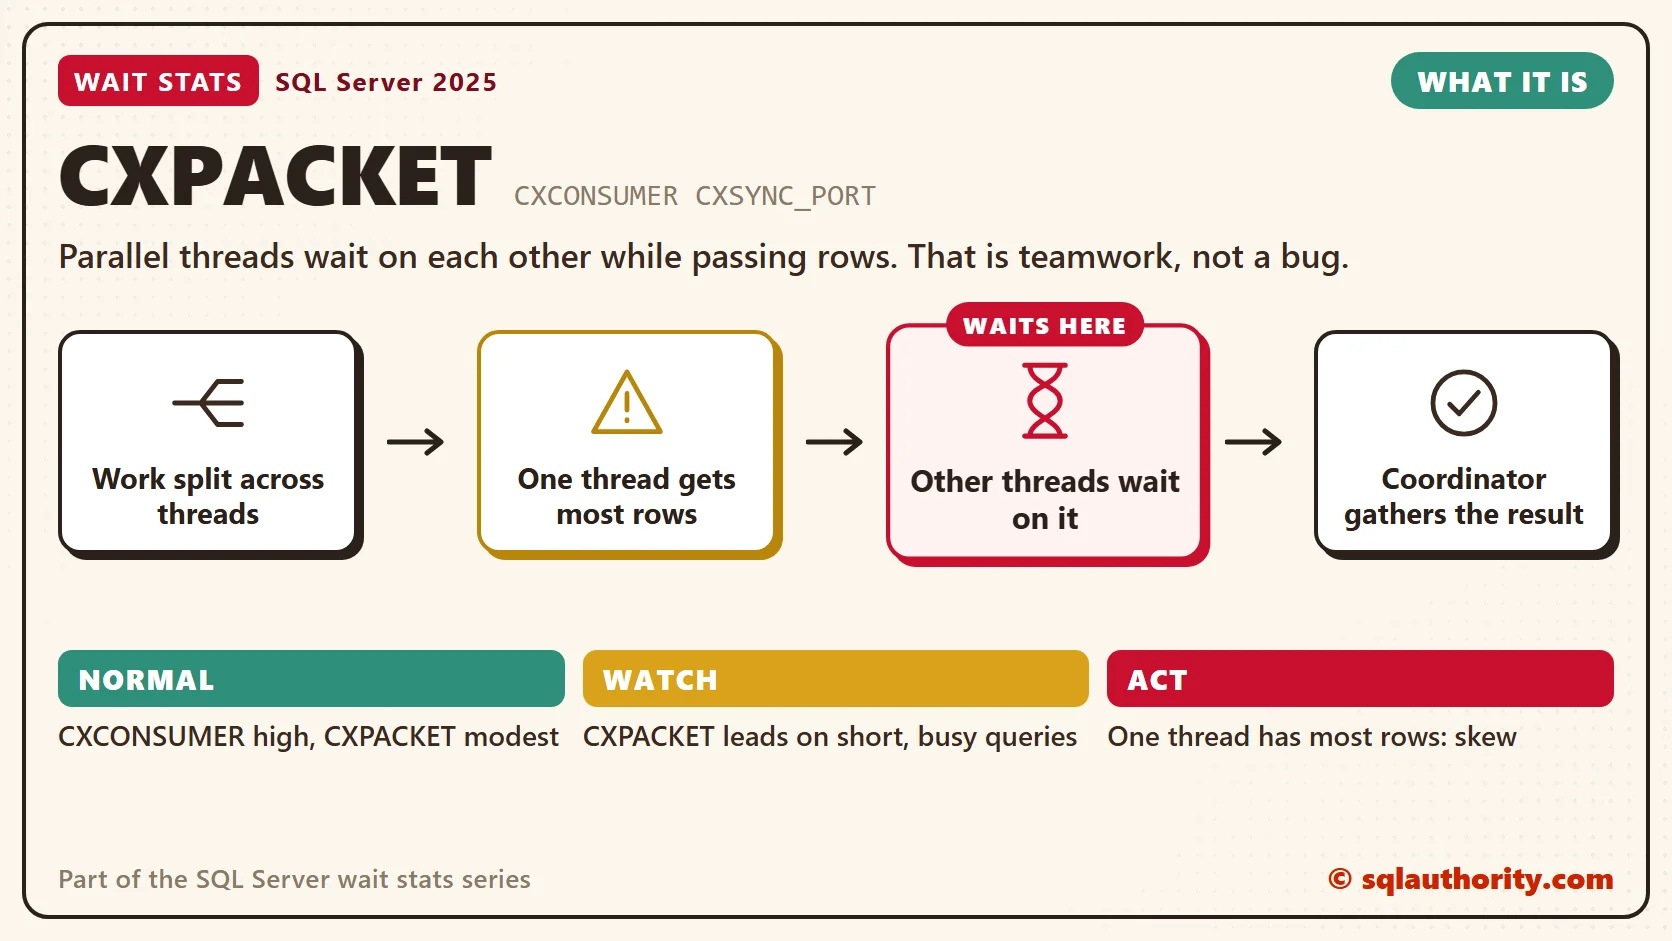
That’s a parallel query. When a query is big enough, SQL Server splits the work across several worker threads. A coordinator thread, Dee in the story, collects the rows and puts the result back together.
Rows travel between threads through operators called exchanges. You’ll see them in a plan as Gather Streams, Repartition Streams and Distribute Streams. Producer threads fill packets with rows. Consumer threads take the packets on the other side. Both sides wait on each other sometimes, and SQL Server names those waits:
- CXCONSUMER: a consumer thread waits for a producer to send rows. That’s Dee waiting for the pancakes. It’s a normal part of every parallel query, and you can’t tune it directly.
- CXPACKET: the producer side of the handoff. A producer with rows ready can wait here for room in a packet. That’s Ace holding plates over a full shelf.
- CXSYNC_PORT: threads waiting while an exchange opens, closes or syncs its ports. A long sort before an exchange can push this one up.
- CXSYNC_CONSUMER: consumer threads waiting at a sync point until all of them get there.
CXCONSUMER was split out in SQL Server 2017 CU3 and 2016 SP2. On SQL Server 2022 and later, syncing the exchange moved out of CXPACKET into the two CXSYNC waits. Before the splits, all of this landed in CXPACKET. That’s why so many old articles call CXPACKET a problem. Much of it was Dee waiting at the pass, which is how parallel work is supposed to look.
Parallelism Is Not the Enemy
You could say the fix is easy: set MAXDOP to 1 and the parallel waits disappear. Fair point, they do. But try that on a reporting server. The waits vanish from the list, and reports that used to finish before breakfast finish after lunch.
The bus fed forty people in twenty-six minutes with four cooks. That’s a win. Parallel waits only matter when the split was wasteful or unfair, and two patterns cause most of that.
Skew is the pancake problem. The rows are divided unevenly, so one thread gets most of the work while the others finish early and wait. A common cause is rows split by a value that one group dominates. In an actual execution plan, open an operator’s properties and look at Actual Number of Rows per thread. One thread with most of the rows is skew.
A big scan in disguise is the other pattern. In my health checks, high parallel waits on a busy OLTP server usually lead back to a missing index. The query scans a whole table, the cost goes up, and the optimizer goes parallel. Add the right index, and the query does a fraction of the work. When its estimated serial cost falls below the cost threshold, the optimizer won’t consider a parallel plan. Check the new plan to confirm it went serial.
Normal or a Problem?
| Situation | What it means | What to do |
|---|---|---|
| CXCONSUMER is high and CXPACKET is modest | Normal parallel work. Consumers wait for rows. | Leave it when the queries run fast enough. If one is slow, check it for skew. |
| CXPACKET leads on a server of short, busy queries | Small queries go parallel when they shouldn’t. | Check cost threshold and MAXDOP (Parallelism Wait Stats). |
| One query waits long, and one thread has most of the rows | Skew. One thread does the work for all. | Fix estimates and statistics, or rewrite the query. |
| Parallel waits arrive with PAGEIOLATCH and huge reads | Big scans that went parallel. | Find the scan and index for it (PAGEIOLATCH Wait Stats). |
| CXSYNC_PORT stands out | Big sorts or builds before an exchange. | Look at the sorts in the plan and their memory. |
See It on Your Server
This first query reads the four parallel waits from the clipboard. Compare them with your filtered top waits from the sys.dm_os_wait_stats post. Better yet, measure a busy hour with Wait Stats Over Time.
-- Parallel waits since the last restart
SELECT wait_type,
       waiting_tasks_count,
       wait_time_ms,
       CAST(1.0 * wait_time_ms / NULLIF(waiting_tasks_count, 0) AS decimal(18, 2)) AS avg_wait_ms,
       signal_wait_time_ms
FROM sys.dm_os_wait_stats
WHERE wait_type IN (N'CXPACKET', N'CXCONSUMER', N'CXSYNC_PORT', N'CXSYNC_CONSUMER')
ORDER BY wait_time_ms DESC;
Look at the mix first. When CXCONSUMER carries most of the time, the exchanges work as designed. A slow query can still hide behind it, so check that query’s rows per thread and its other waits. When CXPACKET leads by a wide margin, keep reading.
The second query catches parallel requests in the act. It shows one row per waiting thread. Run it while a big query is running.
-- Parallel threads waiting right now
SELECT wt.session_id,
       wt.exec_context_id,
       wt.wait_type,
       wt.wait_duration_ms,
       wt.blocking_exec_context_id,
       r.dop
FROM sys.dm_os_waiting_tasks AS wt
JOIN sys.dm_os_tasks AS tk
    ON tk.task_address = wt.waiting_task_address
JOIN sys.dm_exec_requests AS r
    ON r.session_id = tk.session_id
   AND r.request_id = tk.request_id
WHERE wt.wait_type LIKE N'CX%'
ORDER BY wt.session_id, wt.exec_context_id;
Thread 0 is the coordinator, Dee at the pass. The dop column is the degree of parallelism, the thread limit per parallel branch. A plan with several branches uses more threads than that. Say most threads of one session are waiting, and one thread is missing from the list. That thread isn’t waiting on the exchange. It’s still working, or waiting on something else, such as a disk read. When it’s still working, that’s your pancake cook.
Fix It
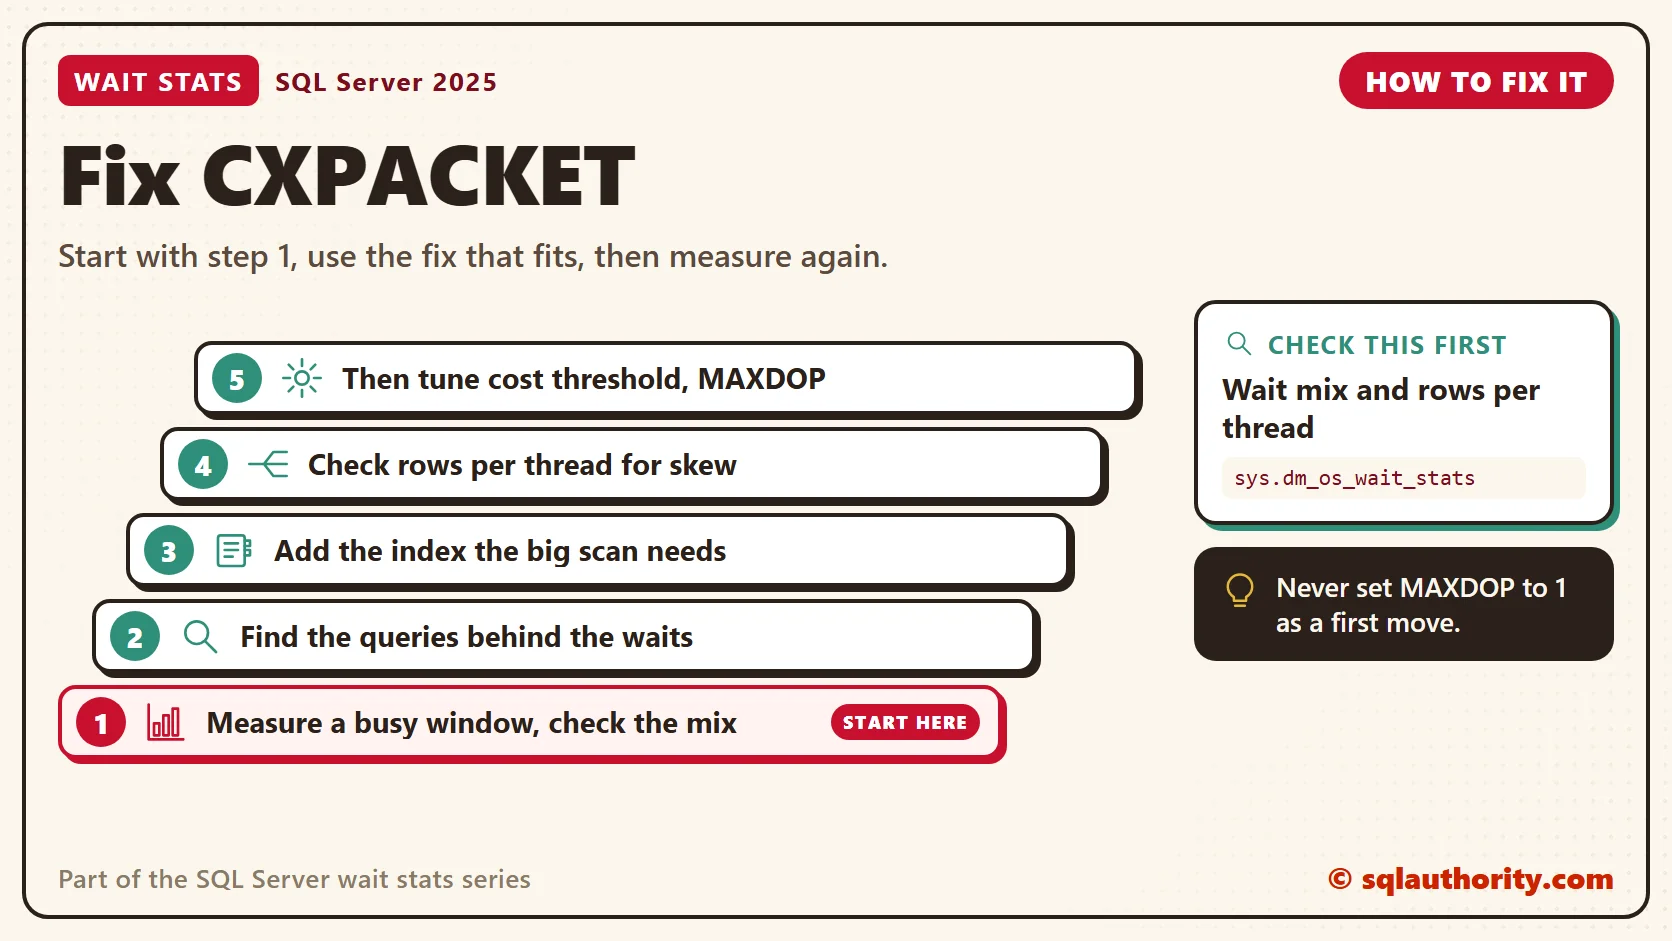
- Measure a busy window and check the mix. If CXCONSUMER carries the time and the queries are fast enough, stop here.
- Find the queries behind the waits. In Query Store, sys.query_store_wait_stats groups these waits under the category Parallelism.
- Open the actual plan of the top query. Look for big scans, and add the index the scan is begging for.
- Check rows per thread for skew. Update statistics, then fix the query shape if one thread still does it all.
- Only then tune the server settings, cost threshold and MAXDOP. The next post covers both.
- Never set MAXDOP to 1 for the whole server as a first move. It hides the waits and slows the big work.
New in SQL Server 2022 and 2025
The SQL Server 2022 wait docs list CXSYNC_PORT and CXSYNC_CONSUMER as their own waits. Expect to see them on the list. CXCONSUMER stays what it has been since the split: normal, and not something you tune directly.
The bigger change is in SQL Server 2025. DOP feedback is now on by default in Enterprise and Enterprise Developer editions. It needs compatibility level 160 or higher and Query Store in READ_WRITE mode. It watches repeating parallel queries and lowers their thread count when the extra threads only wait. That changes the parallel wait mix on many servers, and the next post explains how it works.
Related Reading
- Uneven Parallelism: Spotting Skewed Threads Behind CXPACKET Waits
- CXSYNC_PORT and CXSYNC_CONSUMER Waits in Parallel Queries
- Reducing CXPACKET Wait Stats for High Transactional Database
The Clipboard Diner, a wait stats series. Previous: Wait Stats Over Time: Measuring One Time Window. Next: Parallelism Wait Stats: Tuning MAXDOP and Cost Threshold. Every post is listed in the series guide.
Tomorrow night, Casey writes two house rules for big parties on the kitchen door.
CXPACKET is not a problem to switch off, it is a team that needs a fair split.
Published by Pinal Dave on SQLAuthority. More of my work at pinaldave.com.
Discover more from SQL Authority with Pinal Dave
Subscribe to get the latest posts sent to your email.



15 Comments. Leave new
Pinal,
CXPACKET waits aren’t necessarily bad, or even a sign of a problem, they are normal and expected if queries are executing using parallelism. I wouldn’t recommend that CXPACKET alone ever be considered a reason to reduce or change the configuration of the ‘max degree of parallelism’ configuration option. Most newer servers are going to be NUMA based systems, and the best practice recommendation for this configuration option is to set it to the number of processor cores in a single NUMA node. Generally speaking this best practice is not followed, and most recommendations show changing the ‘max degree of parallelism’ configuration option to 1 or 2 whenever the topic of CXPACKET comes up.
My recommendation, especially on newer NUMA based systems is always to first set it following best practices to the number of physical cores in a single NUMA node and then monitor. You can find the number of schedulers in each NUMA node by querying the online_scheduler_count from sys.dm_os_nodes. Even for data warehouse environments, this should be set initially following this practice unless testing has shown that leaving it at 0 is actually best, which is possible.
After making the change monitor not just wait types, but also for how the system is performing. Look for queries that run under parallelism and test them manually using different levels of DOP using the OPTION(MAXDOP n) query hint to see if reducing parallelism actually improves or harms performance. You might find that reducing it for one query improves performance while the rest of the workload shows a performance decrease from that same tested reduction. In that case putting the query hint in, either as a plan guide for the individual query, or by changing the code if you have access, would yield better returns.
Hi Jonathan,
Your comment is excellent I am updating blog post to suggest people read your comment.
Many thanks,
Hello Jonathan,
Could you please tell me what is recommended CTP and MAXDOP value on my sql 2008 X64 standard edition. Mentioned below is the o/p sys.dm_os_nodes
0 ONLINE 0x000000000BD50080 0x0000000000FC4248 0x000000000E89C1A0 1 16773120 12 11 42 5 3665920 12873728 1
1 ONLINE 0x0000000000FC6080 0x0000000000FC4578 0x0000000022BD21A0 0 4095 12 11 42 5 0 0 1
64 ONLINE DAC 0x0000000023A30080 0x0000000000FC48A8 0x0000000023A3E1A0 0 0 1 1 1 1 0 0 0
Pinal, Jonathan, anyone.
Is there any rule of thumb like in what kind of situations this is bad for the performance? I’d guess that servers where there is many INSERT/UPDATEs with simultanous SELECTs with lot of CXPACKET waits is not a good thing.
I’m asking because one of our system shows many, many rows with lastwaittype=CXPACKET when I query the sys.sysprocesses view almost any given time. The application that uses the database is sluggish and I’m 99% sure that it’s because of the database or to be precise because of the queries ran against the database.
Thanks in advance,
Marko
Marko,
In general, OLTP systems don’t benefit from parallelism, but peoples definition of what an OLTP system is differs. A lot of OLTP systems these days are not strictly used for OLTP workloads, but also support reporting as well. It is possible that the problem could be parallelism in that scenario, and it is possible and more likely that a detailed analysis of the reporting side would show that code changes, index changes, or overall implementation changes would solve the problems.
As I mentioned in my first comment, I look at the queries that are executing using parallelism and determine why. Is there a missing index, are the estimates made by the optimizer significantly different from the actual results in the execution plan? How frequently are the queries being executed? It could be that changing the ‘cost threshold for parallelism’ option to a higher value would reduce the number of queries running under parallelism, but still allow more expensive queries to utilize parallelism. The hardware being used is also a factor in what you do.
This is really a huge “It Depends” type of subject, and a lot of things come into play that have to be looked at to determine what is best. If you’d like some assistance with looking at the problem feel free to contact me.
Hi Pinal,
Very good article to understand the role of Wait Types in perfomance ……Just wanted to correct it here that in your blog you have mentioned to change ‘Max Degree Of Paralleism’ to 1 or 0 as per the system (OLAP/OLTP)’ but in your query you have used ‘cost threshold for parallelism’ parameter. please correct it to avoid any confusion.
Thanks,
Nilesh
Pinal,
I think there is a mistake in your post. For pure OLTP and OLAP systems you are giving (correctly) advice for MaxDOP, but the code states (incorrectly) :
EXEC sys.sp_configure N’cost threshold for parallelism’, N’1′
Also, I want to express some concern about the hard advice for the MAXDOP=2. Maybe Jonathans advice might give better initial value.
Is this N’max degree of parallelism’ means number of physical CPUs or logical processors ? We have a db box with 2 CPUs x 4 Cores, so, shows 8 logical processors on Task Manager, so, should I set the limit to 1 (half of physical CPUs ) or 4 ( half of 8 logical ) ? Thanks.
When you wrote this command:
EXEC sys.sp_configure N’cost threshold for parallelism’, N’1′
GO
RECONFIGURE WITH OVERRIDE
GO
Did you not mean to reference ‘max degree of parallelism’?
I have a cut over in 3 days and performance testing is under way now. I found that adjusting
EXEC sys.sp_configure N’cost threshold for parallelism’, N’25’
but leaving MaxDOP set to 0 to have the best performance. At least now I have stopped seeing CXPACKET wait types and the performance difference is marginally better.
Duane Lawrence
How do you find the queries that are executing using parallelism ? I have SQL server 2005 installed but the prod database is set at compatibility 80.
How do i find the queries that are executing using parallelism. I have SQL server 2005 installed but the prod database is set at compatibility level 80. I am see the follow wait stats using Glen Barry’s wait SQL
wait_time_s pct running_pct
CXPACKET 1280289.05 51.45 51.45
Like Jonathan has stated. Our OLTP system supports reporting, could the queries by found by using profiler and looking for queries where duration is greater than CPU? Our Maxdop is currently set at 0.
Real quickly, I develop and manage the performance on a (complex) OLTP environment. This means it’s not just crud statements, but some complex selects used in archiving, and analyzing transactions on the fly while doing the inserts, updates, and deletes. Believe it or not, I’ve found the default maxdop of zero works extremely well and just a minor adjustment to degree of par. to 10 or 15 is fine. But what was the main consideration is “CPU head-room”. Does the system max out all procs? or is there adaquate head-room for preventing bottle-necking on CPU? Just another data point to consider. And increased DOP has allowed us to have a much lower ellapsed time in queries while the total CPU times are a little higher. So it would appear we have higher cxpacket waits, but that’s perfectly fine. It’s the net result that matters.
-dp
Thank you, Pinal!
Saved our day today :)
Thank you, Pinal. Great info as always.