
THREADPOOL wait stats mean a task is waiting for a worker thread, because every worker is already busy. It’s one of the scariest waits on any server. New users can’t even log in, and the cause is almost never a shortage of threads.

This post is part of my wait stats series, told as one story at the Clipboard Diner. Every post is listed in the series guide.
Night 16 at the Clipboard Diner
The softball team’s long goodbye was still the talk of the counter the next night. Then the Thursday bowling league came in, loud and hungry, and took booth 7. The captain pointed at the last whole cherry pie and said, “Save that for us. We’ll decide after we eat.” Quinn set the red card on the pie case.
At ten on league night, everybody orders pie. Ace took a ticket, cooked the grilled cheese, plated it and walked to the pie case. The card was up, so Ace stood there holding the plate. Kit did the same. So did Jesse and Jules, and so did the two extra cooks Casey had called in for league night. By 10:30 every cook on the roster stood by the pie case with a ticket in hand.
The door bell rang. A trucker sat at the counter, and Quinn clipped the order slip on the kitchen window. Nobody took it. Every cook already had a ticket, and a cook doesn’t drop a ticket halfway. The bell rang twice more. After ten minutes the trucker shrugged and drove on to the next exit.
Casey couldn’t get through the crowded kitchen either. So Casey went in the back door, the one with the “Owner Only” sign. From there it took one look to see the problem. Casey walked to booth 7 and asked the league to decide on the pie. They took it, the card came down, and six cooks moved at once. Casey wrote: 10:40. Every cook holding a ticket. Nobody free to take one.
What THREADPOOL Means
That’s what SQL Server does when every worker thread is busy. A new task arrives, no worker is free to run it, and it waits with THREADPOOL.
A worker is the thread that runs a task. Every request needs one, and so does every thread of a parallel query. A task keeps its worker for its whole life, even while it waits on a lock. That’s the cook who won’t drop a ticket. The worker goes back to the pool only when the task ends.
The pool has a limit, set by the max worker threads option. The default value is 0, which tells SQL Server to size the pool from your CPU count. Don’t guess the number. Read it from max_workers_count in sys.dm_os_sys_info, because that’s the limit your server is using.
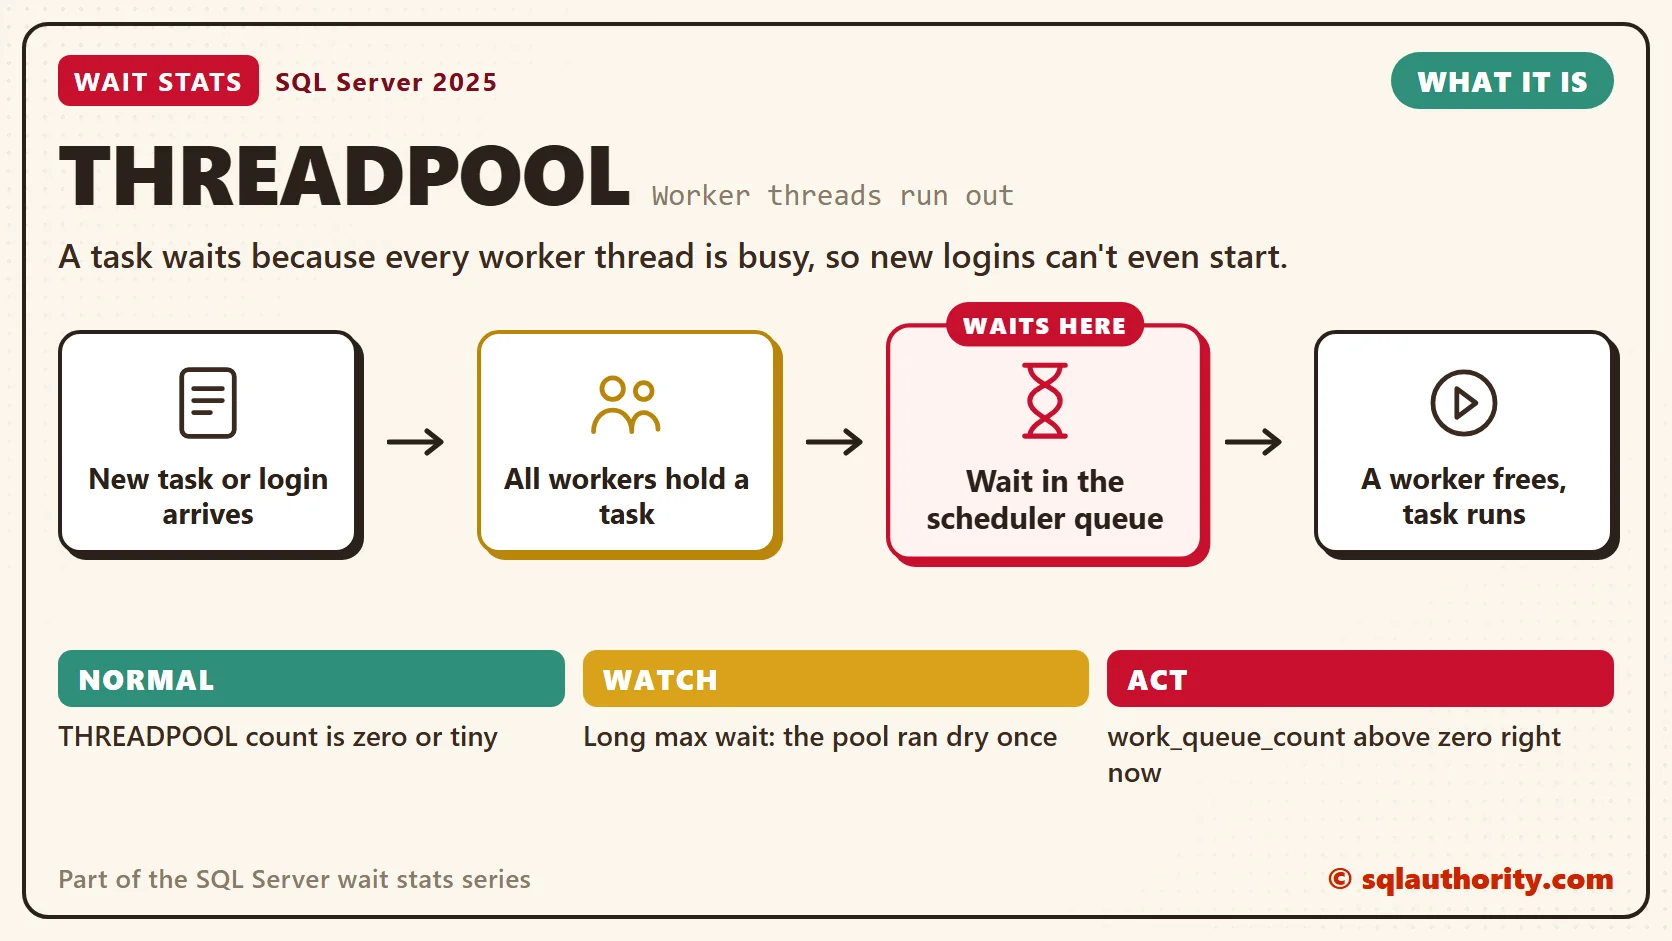
When every worker is taken, new tasks line up in a work queue on each scheduler. The work_queue_count column in sys.dm_os_schedulers counts them. A new login needs a worker too. So the first thing users see is connection timeouts, while sessions that already have workers keep running. The CPU can look calm the whole time, like four cold burners in a full kitchen.
Three things eat the pool. The first is blocking. Every blocked request holds a worker while it waits. A long chain from the LCK_M Wait Stats post can drain it. The second is heavy parallelism. A parallel query reserves a worker for every thread in every branch. One query at DOP 8 can hold far more than eight. The third is a connection storm from the application.
Normal or a Problem?
| Situation | What it means | What to do |
|---|---|---|
| THREADPOOL count is zero or tiny | Normal. Workers were always available. | Nothing. |
| THREADPOOL has waits with a long max_wait_time_ms | The pool ran dry at least once. Users likely saw timeouts. | Find when it happened and what was running then. |
| work_queue_count is above zero right now | Tasks are waiting for a worker this minute. | Connect with the DAC and look for a head blocker. |
| Workers near the limit and many blocked requests | Blocking is holding the pool. | End the head blocker, then fix the transaction. |
| Workers near the limit and many requests with high DOP | Parallelism is holding the pool. | Review MAXDOP and cost threshold for parallelism. |
See It on Your Server
The first query shows how close the pool is to its limit. Run it now, and run it again during your busiest hour.
-- How close is the worker pool to its limit?
SELECT si.max_workers_count,
       (SELECT COUNT(*) FROM sys.dm_os_workers) AS current_workers,
       (SELECT SUM(active_workers_count)
        FROM sys.dm_os_schedulers
        WHERE status = N'VISIBLE ONLINE') AS active_workers,
       (SELECT SUM(work_queue_count)
        FROM sys.dm_os_schedulers
        WHERE status = N'VISIBLE ONLINE') AS tasks_waiting_for_a_worker,
       (SELECT value_in_use
        FROM sys.configurations
        WHERE name = N'max worker threads') AS max_worker_threads_setting
FROM sys.dm_os_sys_info AS si;
The column that matters is tasks_waiting_for_a_worker. A value above zero means THREADPOOL waits are happening right now. If it stays above zero across several runs, the pool is starving. The current_workers count includes system workers and idle ones, so treat it as a rough size, not a health score. A setting of 0 means SQL Server sized the pool itself, and that’s what I want to see.
The second block shows the THREADPOOL history and who holds the workers at this moment.
-- THREADPOOL waits since the last restart
SELECT wait_type,
       waiting_tasks_count,
       wait_time_ms,
       max_wait_time_ms
FROM sys.dm_os_wait_stats
WHERE wait_type = N'THREADPOOL';

-- What the user requests holding workers are doing
SELECT COUNT(*) AS user_requests,
       SUM(CASE WHEN r.blocking_session_id > 0 THEN 1 ELSE 0 END) AS blocked,
       SUM(CASE WHEN r.dop > 1 THEN 1 ELSE 0 END) AS parallel,
       MAX(r.dop) AS highest_dop
FROM sys.dm_exec_requests AS r
JOIN sys.dm_exec_sessions AS s
    ON s.session_id = r.session_id
WHERE s.is_user_process = 1;
When blocked is a big share of user_requests, the pool is waiting on a lock. When parallel and highest_dop are high, a few big queries are holding many workers each.
Getting In When Nobody Can
During a real THREADPOOL event you can’t connect the normal way either. That’s what the dedicated admin connection (DAC) is for. SQL Server keeps a scheduler and memory reserved for it, and only one DAC can be open at a time. It’s Casey’s back door.
In SSMS, open a new query window. In its connect box, type ADMIN: in front of the server name, such as ADMIN:YourServer. Object Explorer can’t use the DAC, so connect a query window only. From a command prompt, use sqlcmd with the -A switch:
sqlcmd -S YourServer -E -A
The DAC works on the server itself by default, except on Express edition, which needs trace flag 7806. From another machine, it works only after you turn on the remote admin connections option. I turn that on during setup, because the day you need it is the day you can’t change it. Keep your DAC queries small: find the head blocker, end it, and get out.
Fix It
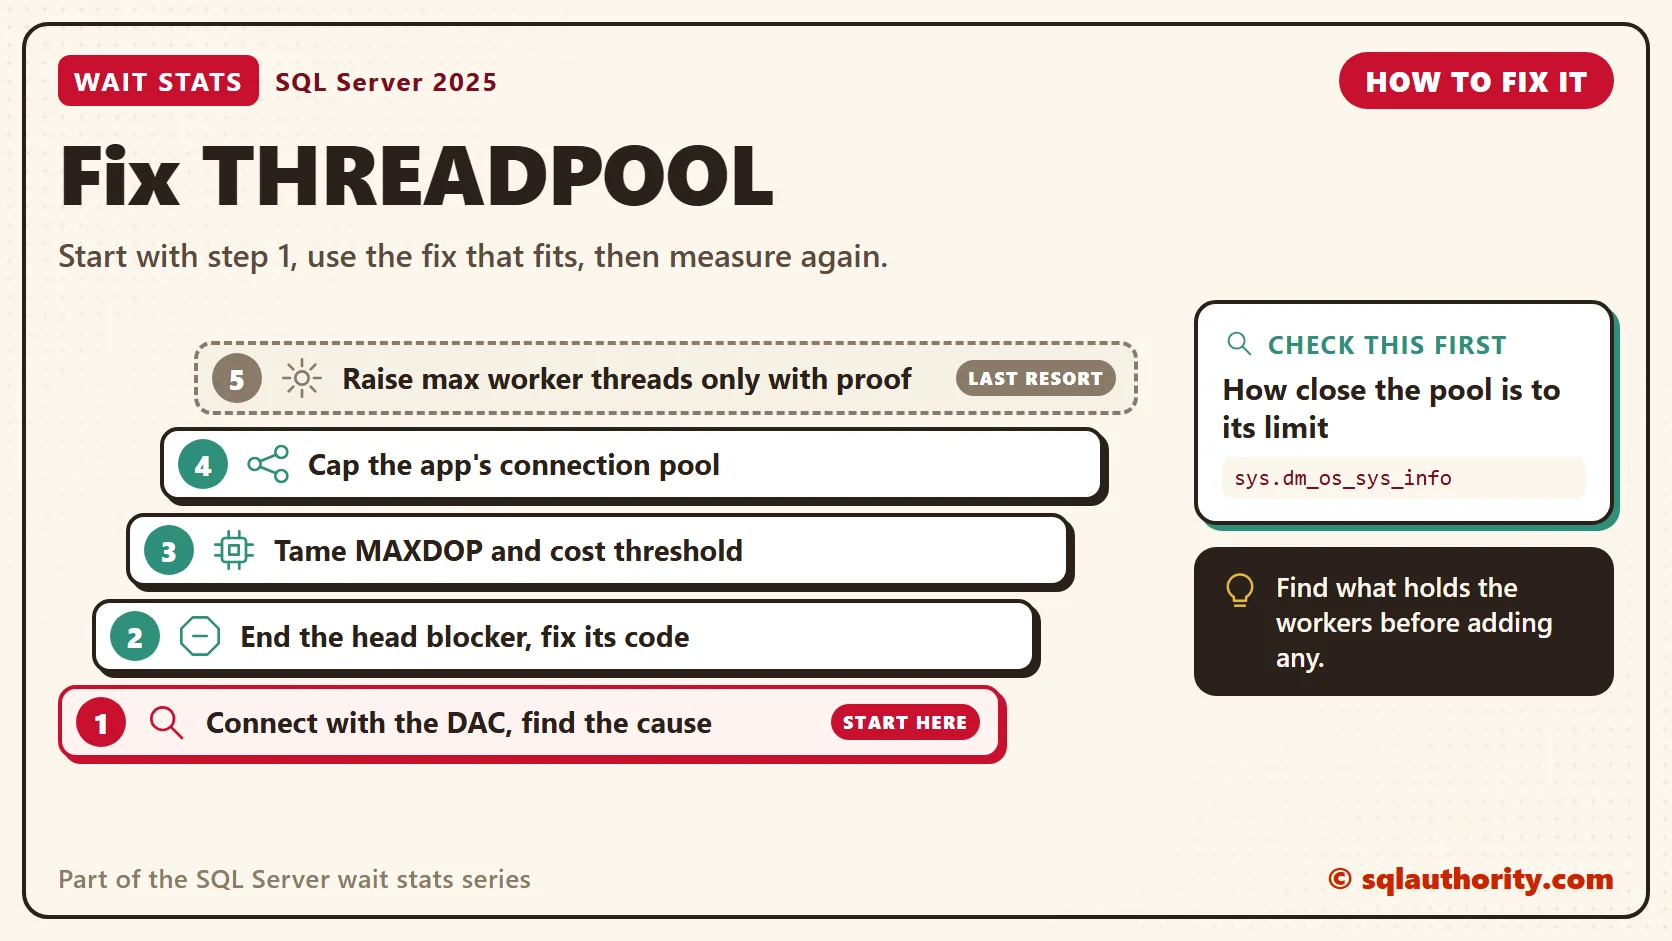
It’s tempting to answer THREADPOOL waits by raising max worker threads, but that makes things worse. Each new worker joins the same line behind the same head blocker, and takes stack memory outside the buffer pool. More threads also fight over the same CPUs. It’s hiring more cooks for a kitchen where nobody can cook.
- Get in with the DAC and find what holds the workers. Run the queries above.
- End the head blocker when blocking holds the pool, then fix the transaction that stayed open.
- Tame parallelism. Set MAXDOP and cost threshold for parallelism with care (Parallelism Wait Stats).
- Check the application. Cap its connection pool, and stop retry loops that open a fresh request every second.
- Raise max worker threads last, in small steps, and only after the first four are done. Watch memory after every change.
You could say some servers need more workers. Fair point. A server with hundreds of availability group databases can need more than the default. But I change this setting last, and I measure before and after. On every other server I’ve seen, the fix lived in steps two to four.
New in SQL Server 2022 and 2025
Nothing new changes what THREADPOOL means. Two changes help indirectly. SQL Server 2025 turns DOP feedback on by default in Enterprise and Enterprise Developer editions. It needs Query Store in READ_WRITE mode and compatibility level 160 or higher. It lowers the DOP of repeating parallel queries that waste threads, so they hold fewer workers.
SQL Server 2025 also adds optimized locking, which is off by default. Fewer lock waits mean fewer blocked workers, and Optimized Locking Wait Stats covers it. Neither one replaces fixing the head blocker.
Related Reading
The Clipboard Diner, a wait stats series. Previous: LCK_M Wait Stats: Lock Waits and Blocking. Next: WRITELOG Wait Stats: Transaction Log Flush Waits. Every post is listed in the series guide.
Tomorrow night, Pat’s pen slows down, and every plate waits at the pass until the sale is written.
THREADPOOL is not a reason to raise the worker limit, it is a sign to find what holds the workers.
Published by Pinal Dave on SQLAuthority. More of my work at pinaldave.com.
Discover more from SQL Authority with Pinal Dave
Subscribe to get the latest posts sent to your email.




2 Comments. Leave new
A quick note upon re-reading this for the xteenth time that I should point out. First, the numbers used as examples for ‘max server memory’ with 16GB and 32GB RAM should not be considered to be best practice numbers, I pulled them out of the air for the purposes of this post because they provided easier numbers to work with. Tuning the ‘max server memory’ sp_configure option should be done based on the requirements of each specific server, through consistent monitoring of the MemoryAvailable MBytes performance counter, which should remain above 150 at all times.
Jonathan’s blog is a must-read and his sessions at events like sqlpass are fantastic. Thanks Jonathan!
(Go Gators)