
IO_COMPLETION wait stats measure queries waiting on disk work that isn’t a normal data page read. The cause I see most is a sort or hash join that ran out of memory and spilled to tempdb. The fix is usually a better estimate, not a faster disk.

This post is part of my wait stats series, told as one story at the Clipboard Diner. Every post is listed in the series guide.
Night 10 at the Clipboard Diner
Casey replaced the stairway bulb first thing Friday, and the basement trips got faster. Then the phone rang. A caller wanted a birthday sheet cake for twelve, ready at eight.
Casey cleared a patch of counter sized for a cake for twelve. That’s how the kitchen works: you claim the space before you start, and you don’t get more halfway through. At 7:30 the birthday crowd rolled in. It was sixty people, the whole county fair committee.
Jesse baked a cake for sixty, but the patch of counter fit a cake for twelve. So Jesse did the only thing left. Half the cake went down the stairs to the folding table in the basement. Jesse frosted a row downstairs, climbed up, frosted a row upstairs, and went back down. The potatoes and the cooler had nothing to do with it. This was Jesse’s own work, done in the slow place.
Meanwhile Casey built a new shelf by the register, because Pat’s order books had filled the old one. It was a small shelf, so it went up in minutes. A big one would need a coat of paint first, and nothing goes on wet paint.
The cake was late but beautiful, and the clipboard got a note for next time: Cake for 12 meant 60. Ask how many are coming.
What IO_COMPLETION Means
That’s a spill. IO_COMPLETION is SQL Server waiting for disk work to finish when that work isn’t a normal data page read. Data page reads are PAGEIOLATCH Wait Stats, the trips for ingredients. IO_COMPLETION is the other disk work, like Jesse frosting in the basement.
In my health checks, the common sources are sorts and hash joins that spill to tempdb. Reading the transaction log during recovery or a rollback shows here too. So does some of the work of growing a file.
Here’s how a spill happens. Before a query runs, SQL Server gives it a memory grant. That’s a fixed amount of memory for its sorts and hashes. The size comes from the estimated row count. Don’t expect an ordinary sort or hash to get more once it starts. When the real rows don’t fit, the sort writes part of its data to tempdb and reads it back later.
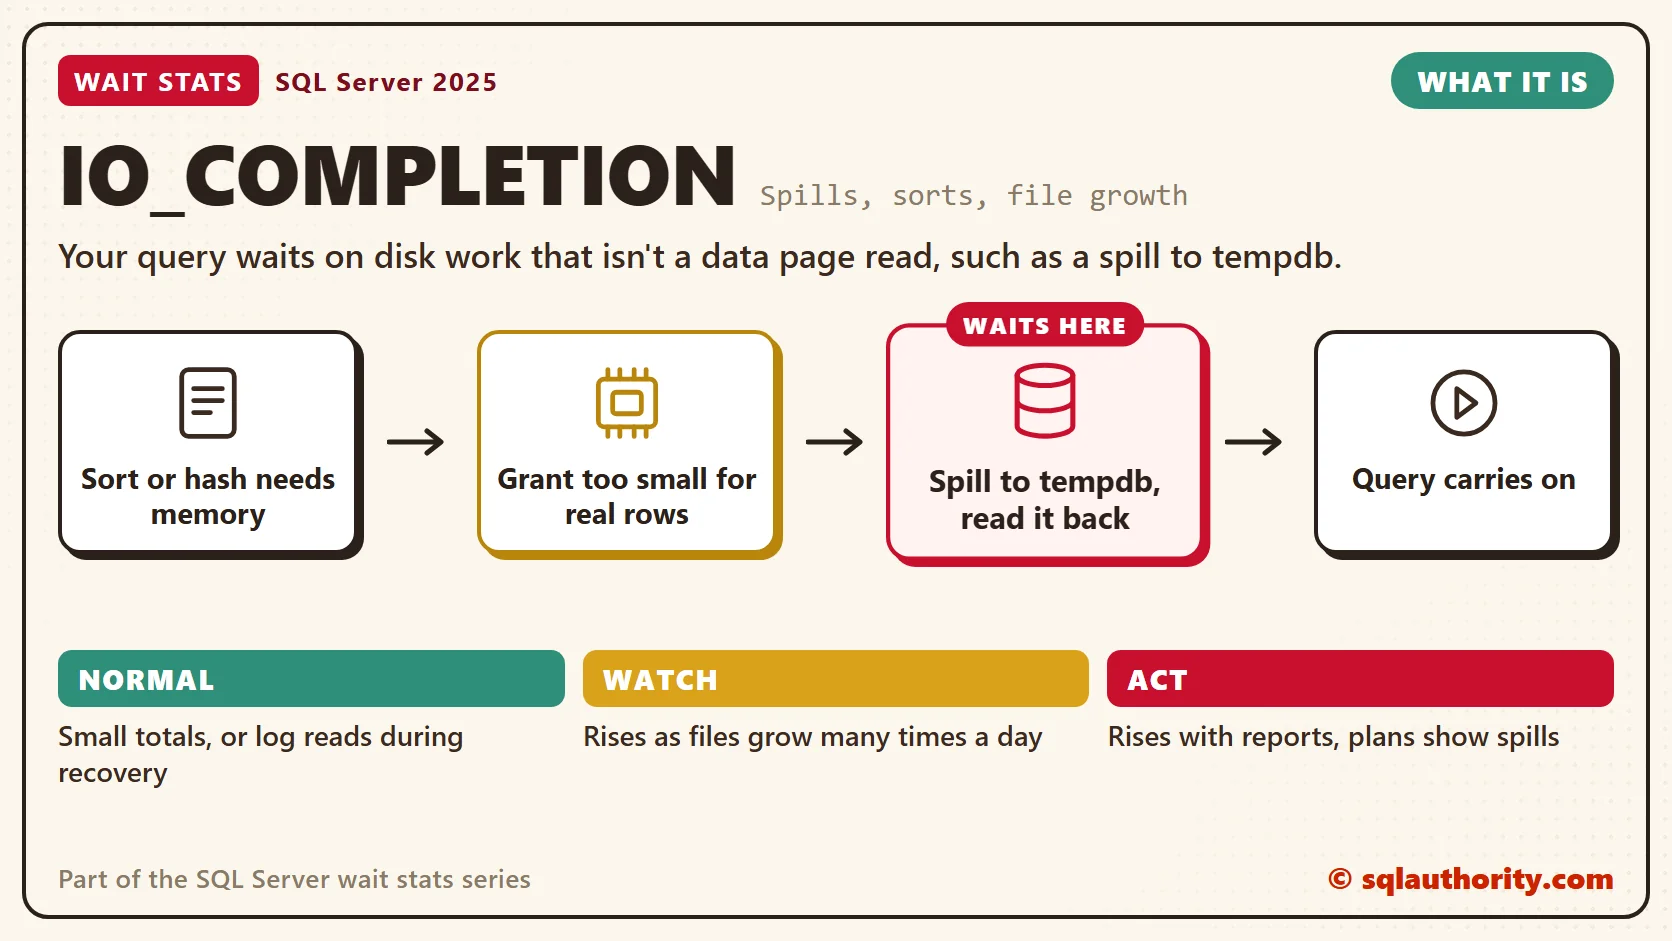
Disk is far slower than memory, so a spilled sort takes much longer than one that fits. The most common root cause is the estimate. The cake order said twelve. Stale statistics, functions wrapped around columns and tricky filters all make estimates wrong.
You could say more server memory would stop spills. Fair point for a huge query that hits the cap on grant size. For a bad estimate, it won’t help. The grant comes from the estimate. A query that expects twelve rows asks for a small grant on any server.
File growth is the other reason this wait is in the title. Growing a file is slow disk work outside data pages. The time can land here, in ASYNC_IO_COMPLETION Wait Stats, or in a PREEMPTIVE wait. It depends on the file and the step. That’s Casey’s shelf.
Normal or a Problem?
| Situation | What it means | What to do |
|---|---|---|
| Small IO_COMPLETION totals, nothing users feel | Background log reads and small jobs. | Normal. Leave it. |
| High for a while after a restart or failover | Recovery is reading the log. | Normal. It settles once recovery ends. |
| Rises with big reports or loads, and plans show spill warnings | Sorts and hashes spill to tempdb. | Find the spilling queries and fix the estimates. |
| Rises when files grow many times a day | Many small growths during busy hours. | Pre-size files and set a fixed growth size. |
See It on Your Server
The first query reads IO_COMPLETION and its neighbor from tomorrow’s post, so you can see which one carries the time.
-- Which non-data-page I/O wait carries the time since the last restart?
SELECT wait_type,
       waiting_tasks_count AS waits,
       CAST(wait_time_ms / 1000.0 AS decimal(18, 1)) AS waited_sec,
       CAST(1.0 * wait_time_ms / NULLIF(waiting_tasks_count, 0) AS decimal(12, 1)) AS avg_wait_ms
FROM sys.dm_os_wait_stats
WHERE wait_type IN (N'IO_COMPLETION', N'ASYNC_IO_COMPLETION')
ORDER BY wait_time_ms DESC;
A rising IO_COMPLETION during report hours points to spills. Measure that window with Wait Stats Over Time instead of trusting totals since the restart.
The second query finds the statements that spilled the most. It turns total_spills, which counts 8 KB pages, into megabytes. It needs SQL Server 2016 SP2, SQL Server 2017 CU3 or later.
-- Which cached statements spill the most to tempdb, in total and per run?
SELECT TOP (10)
       qs.execution_count AS runs,
       CAST(qs.total_spills * 8 / 1024.0 AS decimal(18, 1)) AS spilled_mb,
       CAST(qs.total_spills * 8 / 1024.0 / qs.execution_count AS decimal(18, 1)) AS spilled_mb_per_run,
       CAST(qs.total_grant_kb / 1024.0 / qs.execution_count AS decimal(18, 1)) AS grant_mb_per_run,
       stmt.statement_text
FROM sys.dm_exec_query_stats AS qs
CROSS APPLY sys.dm_exec_sql_text(qs.sql_handle) AS t
CROSS APPLY (SELECT SUBSTRING(t.text, qs.statement_start_offset / 2 + 1,
                 (IIF(qs.statement_end_offset = -1, DATALENGTH(t.text), qs.statement_end_offset)
                  - qs.statement_start_offset) / 2 + 1) AS statement_text) AS stmt
WHERE qs.total_spills > 0
ORDER BY qs.total_spills DESC;
A spilled_mb_per_run far bigger than grant_mb_per_run is a strong hint that the grant was sized for twelve. Take the top statement and open its actual execution plan. A sort or hash operator with a spill warning is your cake in the basement. Compare its estimated rows with its actual rows to see how far off the guess was. If the estimate is close, look at row width, grant limits and memory pressure instead.
Fix It
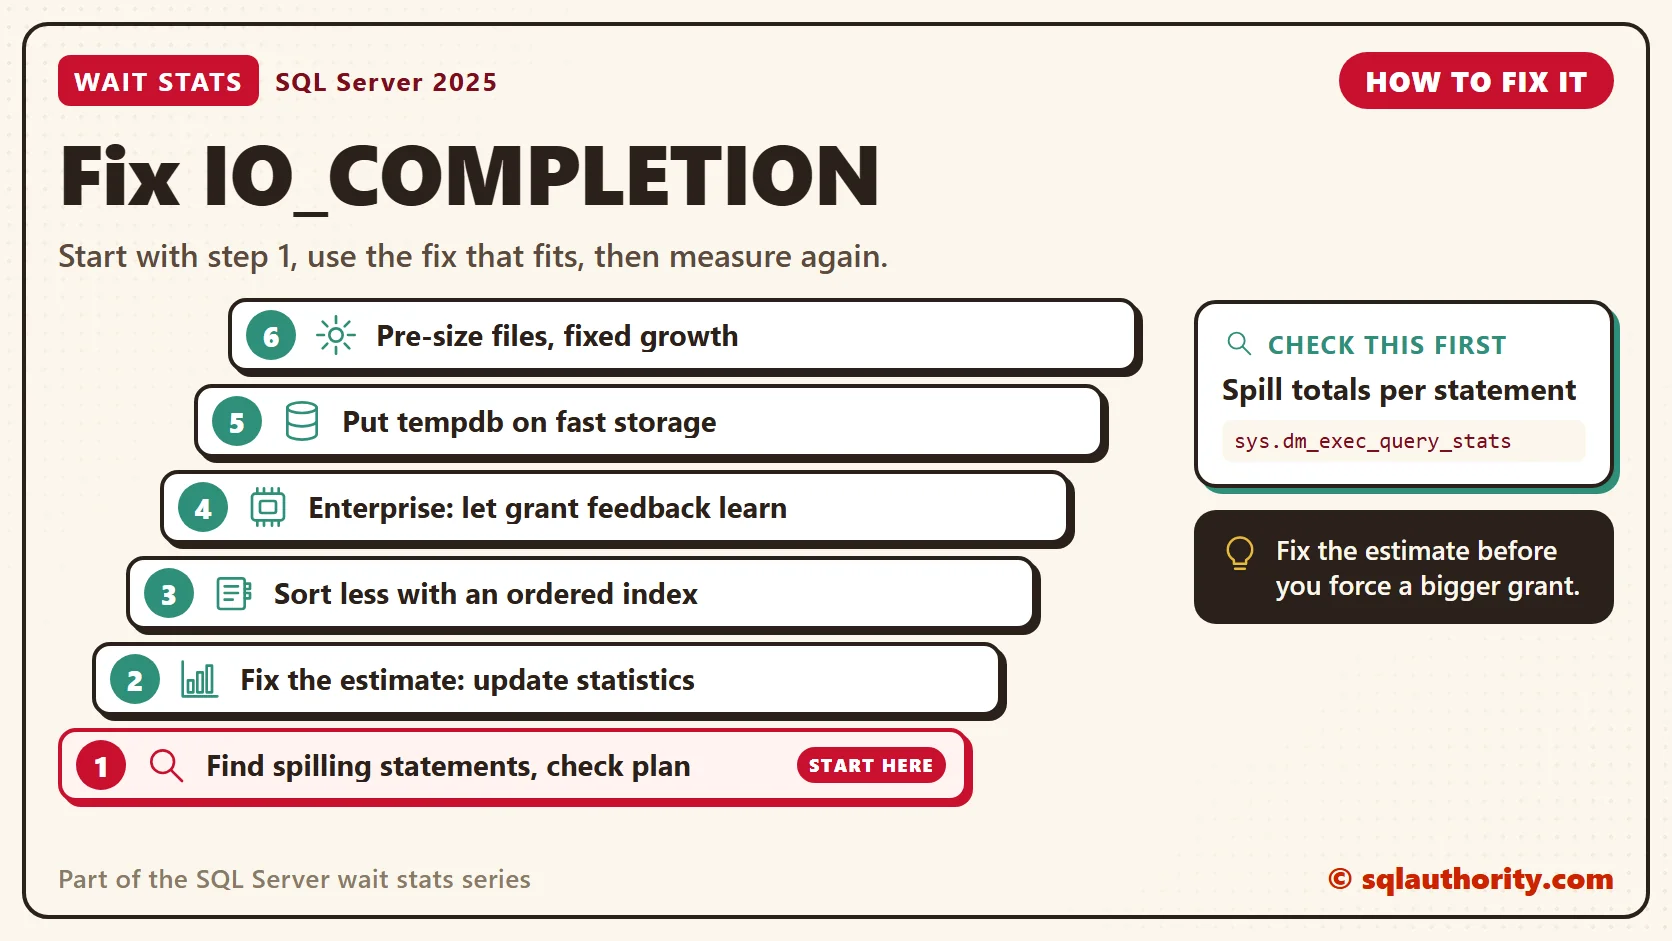
- Find the spilling statements with the query above, and confirm the spill in the actual plan.
- Fix the estimate: update statistics, and remove functions wrapped around filtered columns.
- Sort less. An index that returns rows in order can remove the sort entirely.
- On Enterprise edition, let memory grant feedback learn. It raises the grant on later runs of a query that spilled. Row mode queries need compatibility level 150 or higher.
- Put tempdb on fast storage. Check its rows in the file latency query from the PAGEIOLATCH post.
- Pre-size data and log files, and use fixed growth sizes instead of tiny ones.
A common shortcut is a hint that forces a bigger memory grant. It fixes that one report. Then the data grows, dozens of copies run at once, and they all wait for memory instead. The RESOURCE_SEMAPHORE Wait Stats post covers that mess. Fix the estimate first.
New in SQL Server 2022 and 2025
SQL Server 2022 changed log growth. Log autogrowth up to 64 MB now uses instant file initialization, so the new space isn’t zeroed first. That works in all editions, and each growth of 64 MB or less creates one virtual log file. The 64 MB default log growth isn’t new, it dates from SQL Server 2016. Now that default growth skips the zeros.
SQL Server 2022 also improved memory grant feedback. Percentile mode looks at a query’s past grants instead of only the last one. Persistence keeps the feedback in Query Store, so it survives when the plan leaves the cache. Both help repeating queries stop spilling. They need Enterprise edition, compatibility level 140 or higher and Query Store in READ_WRITE mode.
Related Reading
- Oversized varchar Columns and Inflated Memory Grants
- Introduction to Memory Grant Feedback
- SQL Server 2022 Persistence and Percentile Memory Grant Feedback
The Clipboard Diner, a wait stats series. Previous: PAGEIOLATCH Wait Stats: Waiting for Data From Disk. Next: ASYNC_IO_COMPLETION Wait Stats: Large File Operations. Every post is listed in the series guide.
Next comes the night truck, due at 3 AM to box up the whole cooler.
A spill is not a disk problem, it is work that didn’t fit the memory it was given.
Published by Pinal Dave on SQLAuthority. More of my work at pinaldave.com.
Discover more from SQL Authority with Pinal Dave
Subscribe to get the latest posts sent to your email.




2 Comments. Leave new
I had situation with this wait type when I tried to backuped batabase on Tape. My Tape library have just two mount points for tape. I had this wait type because both mount points were occupated.
I believe the page life expectancy metric is 300 or higher