
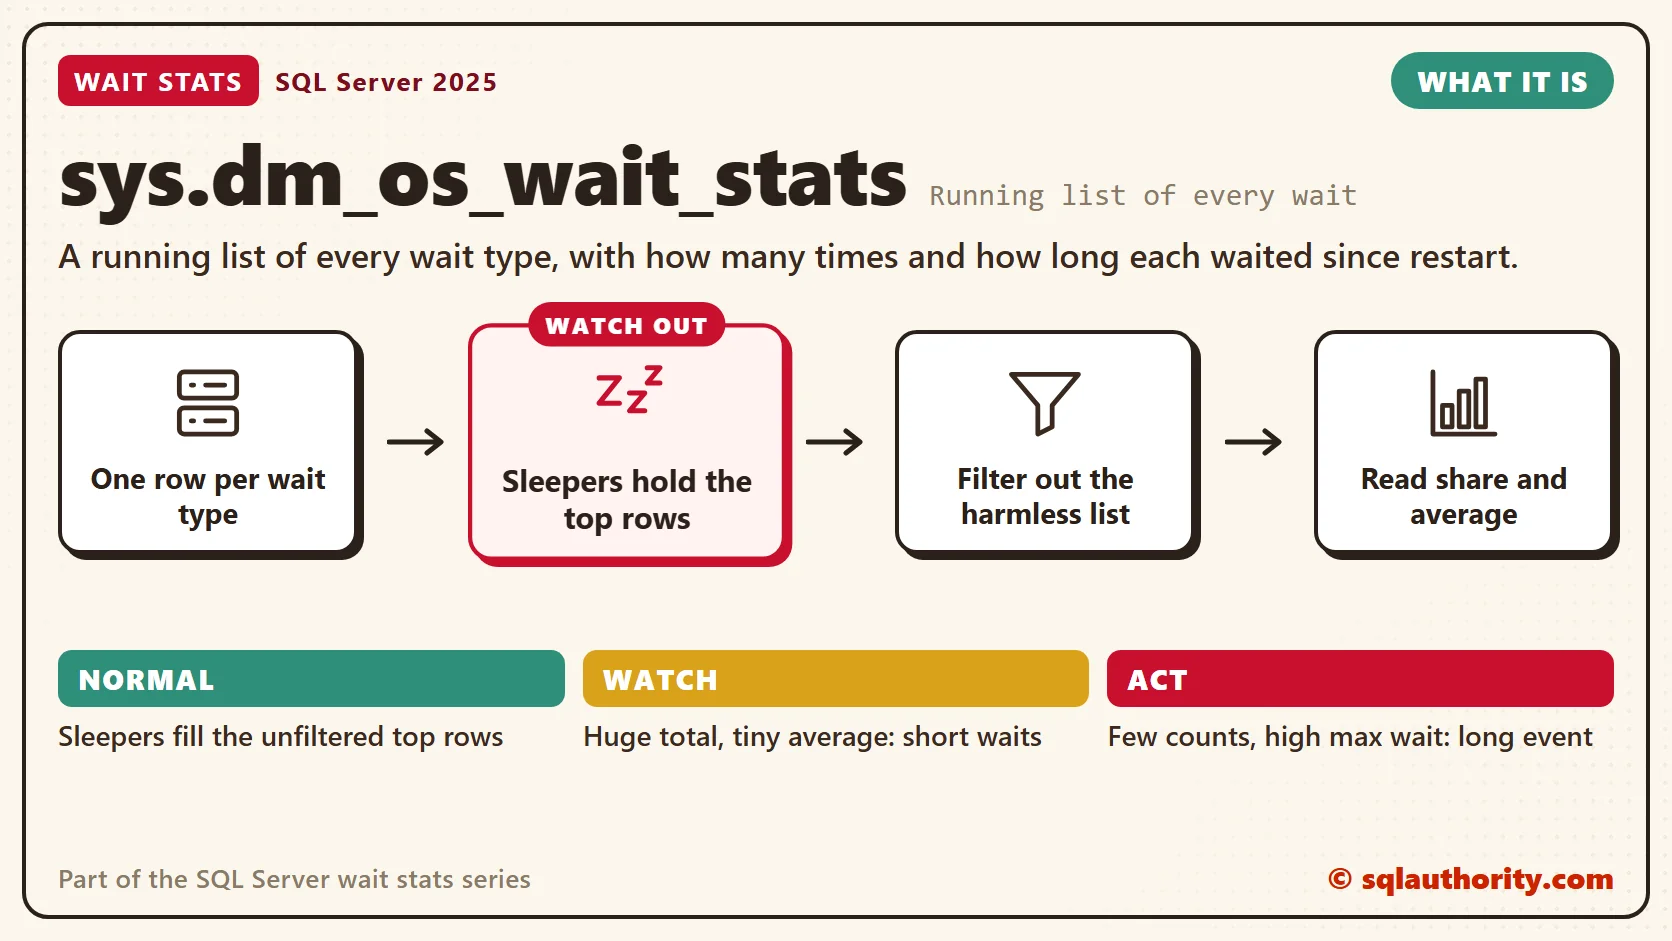
sys.dm_os_wait_stats is SQL Server’s running list of every wait type, with how many times and how long each one waited. The totals start at the last restart. Read it with the right filter and the right math, and it shows where your server spends its waiting time.

This post is part of my wait stats series, told as one story at the Clipboard Diner. Every post is listed in the series guide.
Night 3 at the Clipboard Diner
Two nights of stopwatches had filled the clipboard faster than Casey expected. The rail got its own column after last night, and the column was long. At 2 AM the diner finally went quiet. Rain ticked on the front window, and the neon sign buzzed with its one tired letter.
Casey poured a coffee, slid into booth 2 and read every line. Some were gold: Rail: 4 minutes. Potatoes: 2 minutes. Others made Casey laugh out loud in the empty room.
Night baker: asleep, 6 hours. Dishwasher: waiting for dishes, 3 hours. Jukebox: waiting for a quarter, all night. Those were the biggest numbers on the page. They were also the least useful. No plate of hash in the history of the diner had ever waited on a sleeping baker.
So Casey took a red pen and struck out every line that belonged to someone resting on purpose. The page got shorter, and the lines that survived told the real story of the kitchen. The last trucker paid for a slice of pecan pie and waved on the way out. Under the red lines, Casey wrote: Cross out the sleepers first. Then read.
What sys.dm_os_wait_stats Shows
That clipboard is what SQL Server keeps for you. The view sys.dm_os_wait_stats has one row per wait type. SQL Server adds to that row every time a task waits. It keeps counting until the service restarts.
The view has five columns, and each one answers a plain question.
- wait_type is the name of the wait, such as PAGEIOLATCH_SH or LCK_M_X.
- waiting_tasks_count is how many times a task waited on it.
- wait_time_ms is the total time spent in this wait, in milliseconds. It includes the signal wait.
- max_wait_time_ms is the single longest wait of that type.
- signal_wait_time_ms is the time spent in line for a CPU after the resource was ready. The Signal Wait Stats post explains that split.
From those columns I work out two numbers. The share of all wait time tells me which waits matter. The average wait, total time divided by count, tells me what kind of problem it is.
Ten waits of one minute each add up to 10 minutes. So do 1.2 million waits of half a millisecond. Both look the same in wait_time_ms, and they need different fixes. The first smells like blocking or one stuck process. The second smells like a busy workload doing tiny things a huge number of times.
Since When?
Every number in this view counts from the last restart. If your server has run for 90 days, a bad afternoon from last month is still in there. So I always check the start time first, with sys.dm_os_sys_info.
You can reset the counts by hand with DBCC SQLPERF(N’sys.dm_os_wait_stats’, CLEAR). I rarely do. It wipes the history for everyone, including any monitoring tool that reads the same view. The start time won’t show that the clear happened, either.
Some teams clear the stats every Monday morning so the numbers look fresh. Then someone asks about a slowdown from the Saturday before, and that evidence is gone. I leave the totals alone and take two snapshots instead. The Wait Stats Over Time post shows how.
Cross Out the Sleepers
Many rows in this view belong to background tasks that wait on purpose. The lazy writer sleeps between checks. Service Broker and Extended Events tasks sit idle until work arrives. Their wait time grows with uptime, not with load, so they float to the top and bury the real story.
My main query removes them with a list I keep in a small table. It holds 87 waits, each with a short why code (sleep, idle, startup and more) that says why it’s ignored. To skip a sleeper of your own, add one line. The list also drops WAITFOR, because a session running WAITFOR DELAY waits on purpose.
I checked the list against current SQL Server 2025 builds and the best-known wait scripts in our field. I use the same list everywhere in this series. The Harmless Wait Stats post explains the list and how to spot a new sleeper yourself.
You could say a filter hides things. That’s a fair worry. This list only removes waits that belong to system tasks waiting for work. I never add a wait to it to make a chart look better. CXCONSUMER, MEMORY_ALLOCATION_EXT and every PREEMPTIVE_OS_ wait stay in, even when they’re big. Each one can point at real work, such as an uneven parallel plan or a slow call into Windows.
Normal or a Problem?
| Situation | What it means | What to do |
|---|---|---|
| The unfiltered top rows are LAZYWRITER_SLEEP, SLEEP_TASK and friends | Normal. Background tasks resting. | Filter them out with the list below. |
| A wait has a huge total but a tiny average | Many short waits from a busy workload. | Look at the count before you blame hardware. |
| A wait has few counts but a high max_wait_time_ms | One or a few long events, such as a blocking episode. | Catch it while it happens (see Live Wait Stats). |
| The server has run for months | Your busy hour is diluted by everything else. | Measure one window (Wait Stats Over Time). |
| A wait you don’t recognize sits near the top | A new feature, or a sleeper you haven’t met. | Look it up before you filter it. |
See It on Your Server
First, check how long the counts have been adding up. A few hours of history and a few months of history tell different stories. This shows service uptime, the longest the counts can cover. A manual clear makes the real window shorter.
-- Service uptime: the longest the wait counts can cover
SELECT sqlserver_start_time,
       DATEDIFF(HOUR, sqlserver_start_time, SYSDATETIME()) AS uptime_hours
FROM sys.dm_os_sys_info;
This is the main query of the series. It filters out the harmless waits, then shows each wait’s share, average, longest wait and signal part. Run the whole block at once, harmless list included.
-- Run the whole block at once: the list and the query share one batch.
-- The harmless list: background housekeeping and deliberate pauses, not user work.
-- why: sleep = sleeps until needed, idle = waits for background work, startup = only at startup,
-- waitfor = asked to wait, broker/ag/trace/qstore/fulltext/xtp/clr = feature housekeeping,
-- internal = internal background task.
DECLARE @harmless TABLE (wait_type nvarchar(60) PRIMARY KEY, why varchar(10) NOT NULL);
INSERT @harmless (wait_type, why) VALUES
    (N'LAZYWRITER_SLEEP', 'sleep'), (N'SLEEP_BPOOL_FLUSH', 'sleep'), (N'SLEEP_TASK', 'sleep'),
    (N'SP_SERVER_DIAGNOSTICS_SLEEP', 'sleep'), (N'CHECKPOINT_QUEUE', 'idle'),
    (N'DIRTY_PAGE_POLL', 'idle'), (N'DISPATCHER_QUEUE_SEMAPHORE', 'idle'),
    (N'KSOURCE_WAKEUP', 'idle'), (N'LOGMGR_QUEUE', 'idle'), (N'ONDEMAND_TASK_QUEUE', 'idle'),
    (N'PREEMPTIVE_SP_SERVER_DIAGNOSTICS', 'idle'), (N'REQUEST_FOR_DEADLOCK_SEARCH', 'idle'),
    (N'RESOURCE_QUEUE', 'idle'), (N'SERVER_IDLE_CHECK', 'idle'), (N'SNI_HTTP_ACCEPT', 'idle'),
    (N'SOS_WORK_DISPATCHER', 'idle'), (N'UCS_SESSION_REGISTRATION', 'idle'),
    (N'VDI_CLIENT_OTHER', 'idle'), (N'CHKPT', 'startup'),
    (N'PWAIT_ALL_COMPONENTS_INITIALIZED', 'startup'), (N'SLEEP_DBSTARTUP', 'startup'),
    (N'SLEEP_DCOMSTARTUP', 'startup'), (N'SLEEP_MASTERDBREADY', 'startup'),
    (N'SLEEP_MASTERMDREADY', 'startup'), (N'SLEEP_MASTERUPGRADED', 'startup'),
    (N'SLEEP_MSDBSTARTUP', 'startup'), (N'SLEEP_PHYSMASTERDBREADY', 'startup'),
    (N'SLEEP_SYSTEMTASK', 'startup'), (N'SLEEP_TEMPDBSTARTUP', 'startup'),
    (N'STARTUP_DEPENDENCY_MANAGER', 'startup'), (N'WAITFOR', 'waitfor'),
    (N'WAITFOR_TASKSHUTDOWN', 'waitfor'), (N'WAIT_FOR_RESULTS', 'waitfor'),
    (N'BROKER_EVENTHANDLER', 'broker'), (N'BROKER_TASK_STOP', 'broker'),
    (N'BROKER_TO_FLUSH', 'broker'), (N'BROKER_TRANSMITTER', 'broker'), (N'DBMIRRORING_CMD', 'ag'),
    (N'DBMIRROR_DBM_EVENT', 'ag'), (N'DBMIRROR_DBM_MUTEX', 'ag'), (N'DBMIRROR_EVENTS_QUEUE', 'ag'),
    (N'DBMIRROR_WORKER_QUEUE', 'ag'), (N'HADR_CLUSAPI_CALL', 'ag'),
    (N'HADR_FILESTREAM_IOMGR_IOCOMPLETION', 'ag'), (N'HADR_LOGCAPTURE_WAIT', 'ag'),
    (N'HADR_NOTIFICATION_DEQUEUE', 'ag'), (N'HADR_TIMER_TASK', 'ag'), (N'HADR_WORK_QUEUE', 'ag'),
    (N'PARALLEL_REDO_DRAIN_WORKER', 'ag'), (N'PARALLEL_REDO_LOG_CACHE', 'ag'),
    (N'PARALLEL_REDO_TRAN_LIST', 'ag'), (N'PARALLEL_REDO_WORKER_SYNC', 'ag'),
    (N'PARALLEL_REDO_WORKER_WAIT_WORK', 'ag'), (N'PREEMPTIVE_HADR_LEASE_MECHANISM', 'ag'),
    (N'REDO_THREAD_PENDING_WORK', 'ag'), (N'PREEMPTIVE_XE_CALLBACKEXECUTE', 'trace'),
    (N'PREEMPTIVE_XE_DISPATCHER', 'trace'), (N'PREEMPTIVE_XE_GETTARGETSTATE', 'trace'),
    (N'PREEMPTIVE_XE_SESSIONCOMMIT', 'trace'), (N'PREEMPTIVE_XE_TARGETFINALIZE', 'trace'),
    (N'PREEMPTIVE_XE_TARGETINIT', 'trace'), (N'SQLTRACE_BUFFER_FLUSH', 'trace'),
    (N'SQLTRACE_INCREMENTAL_FLUSH_SLEEP', 'trace'), (N'SQLTRACE_WAIT_ENTRIES', 'trace'),
    (N'XE_BUFFERMGR_ALLPROCESSED_EVENT', 'trace'), (N'XE_DISPATCHER_JOIN', 'trace'),
    (N'XE_DISPATCHER_WAIT', 'trace'), (N'XE_LIVE_TARGET_TVF', 'trace'),
    (N'XE_TIMER_EVENT', 'trace'), (N'QDS_ASYNC_QUEUE', 'qstore'),
    (N'QDS_CLEANUP_STALE_QUERIES_TASK_MAIN_LOOP_SLEEP', 'qstore'),
    (N'QDS_PERSIST_TASK_MAIN_LOOP_SLEEP', 'qstore'), (N'QDS_SHUTDOWN_QUEUE', 'qstore'),
    (N'FT_IFTSHC_MUTEX', 'fulltext'), (N'FT_IFTSISM_MUTEX', 'fulltext'),
    (N'FT_IFTS_SCHEDULER_IDLE_WAIT', 'fulltext'), (N'WAIT_XTP_CKPT_CLOSE', 'xtp'),
    (N'WAIT_XTP_HOST_WAIT', 'xtp'), (N'WAIT_XTP_OFFLINE_CKPT_NEW_LOG', 'xtp'),
    (N'WAIT_XTP_RECOVERY', 'xtp'), (N'CLR_AUTO_EVENT', 'clr'),
    (N'AZURE_IMDS_VERSIONS', 'internal'), (N'POPULATE_LOCK_ORDINALS', 'internal'),
    (N'PVS_PREALLOCATE', 'internal'), (N'PWAIT_DIRECTLOGCONSUMER_GETNEXT', 'internal'),
    (N'PWAIT_EXTENSIBILITY_CLEANUP_TASK', 'internal'), (N'SOS_WORKER_MIGRATION', 'internal');
-- Where did the waiting time go since the last restart?
SELECT TOP (15)
       w.wait_type,
       CAST(w.wait_time_ms / 1000.0 AS decimal(18, 1)) AS waited_sec,
       CAST(100.0 * w.wait_time_ms
            / NULLIF(SUM(w.wait_time_ms) OVER (), 0) AS decimal(5, 1)) AS share_pct,
       w.waiting_tasks_count AS times_waited,
       CAST(1.0 * w.wait_time_ms / NULLIF(w.waiting_tasks_count, 0) AS decimal(18, 1)) AS avg_wait_ms,
       w.max_wait_time_ms,
       CAST(100.0 * w.signal_wait_time_ms
            / NULLIF(w.wait_time_ms, 0) AS decimal(5, 1)) AS signal_pct
FROM sys.dm_os_wait_stats AS w
WHERE NOT EXISTS (SELECT 1 FROM @harmless AS h WHERE h.wait_type = w.wait_type COLLATE DATABASE_DEFAULT)
  AND w.waiting_tasks_count > 0
ORDER BY w.wait_time_ms DESC;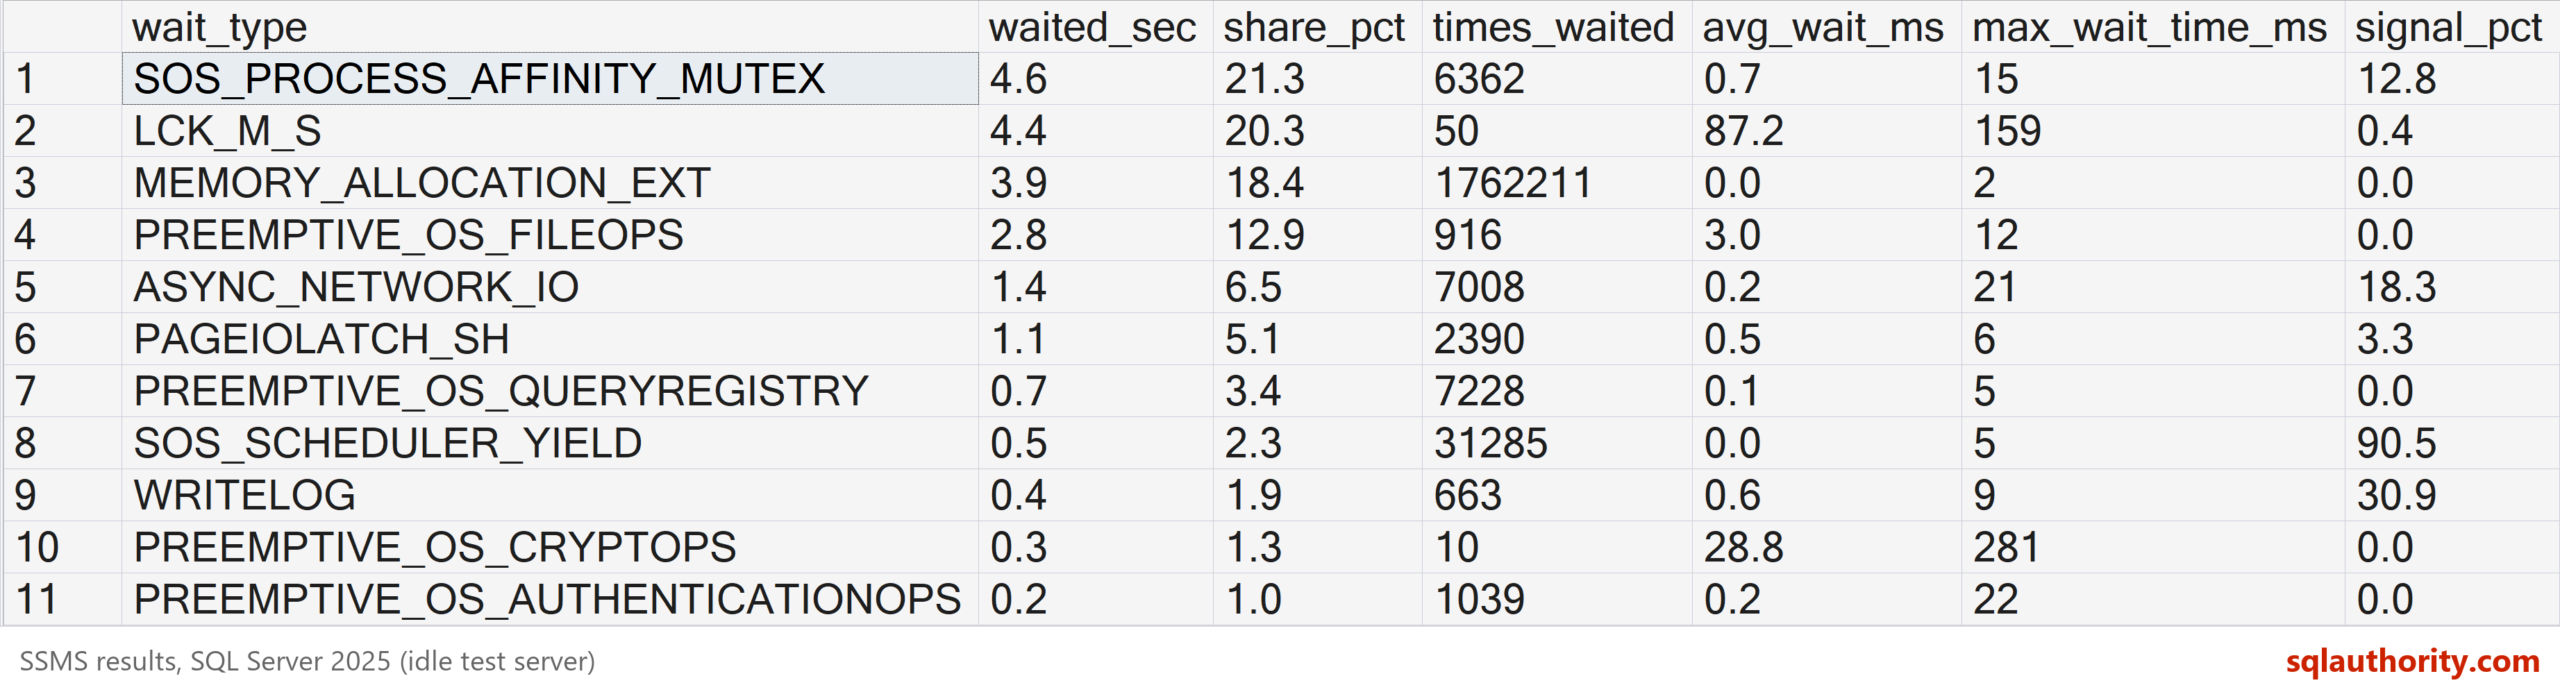
Here’s that query on my test server, an idle SQL Server 2025 machine. With nobody using it, the totals are only a few seconds. Small waits rise to the top because nothing bigger is waiting. On a busy server, expect much larger numbers in the same columns.
Read the top five rows first. The share_pct column shows which ones matter, and avg_wait_ms shows what kind they are. The signal_pct column shows whether the time went to the CPU line. A max_wait_time_ms far above the average points at one bad moment, not a steady problem.
Fix It
This view doesn’t need fixing. It needs reading, in the same order every time.
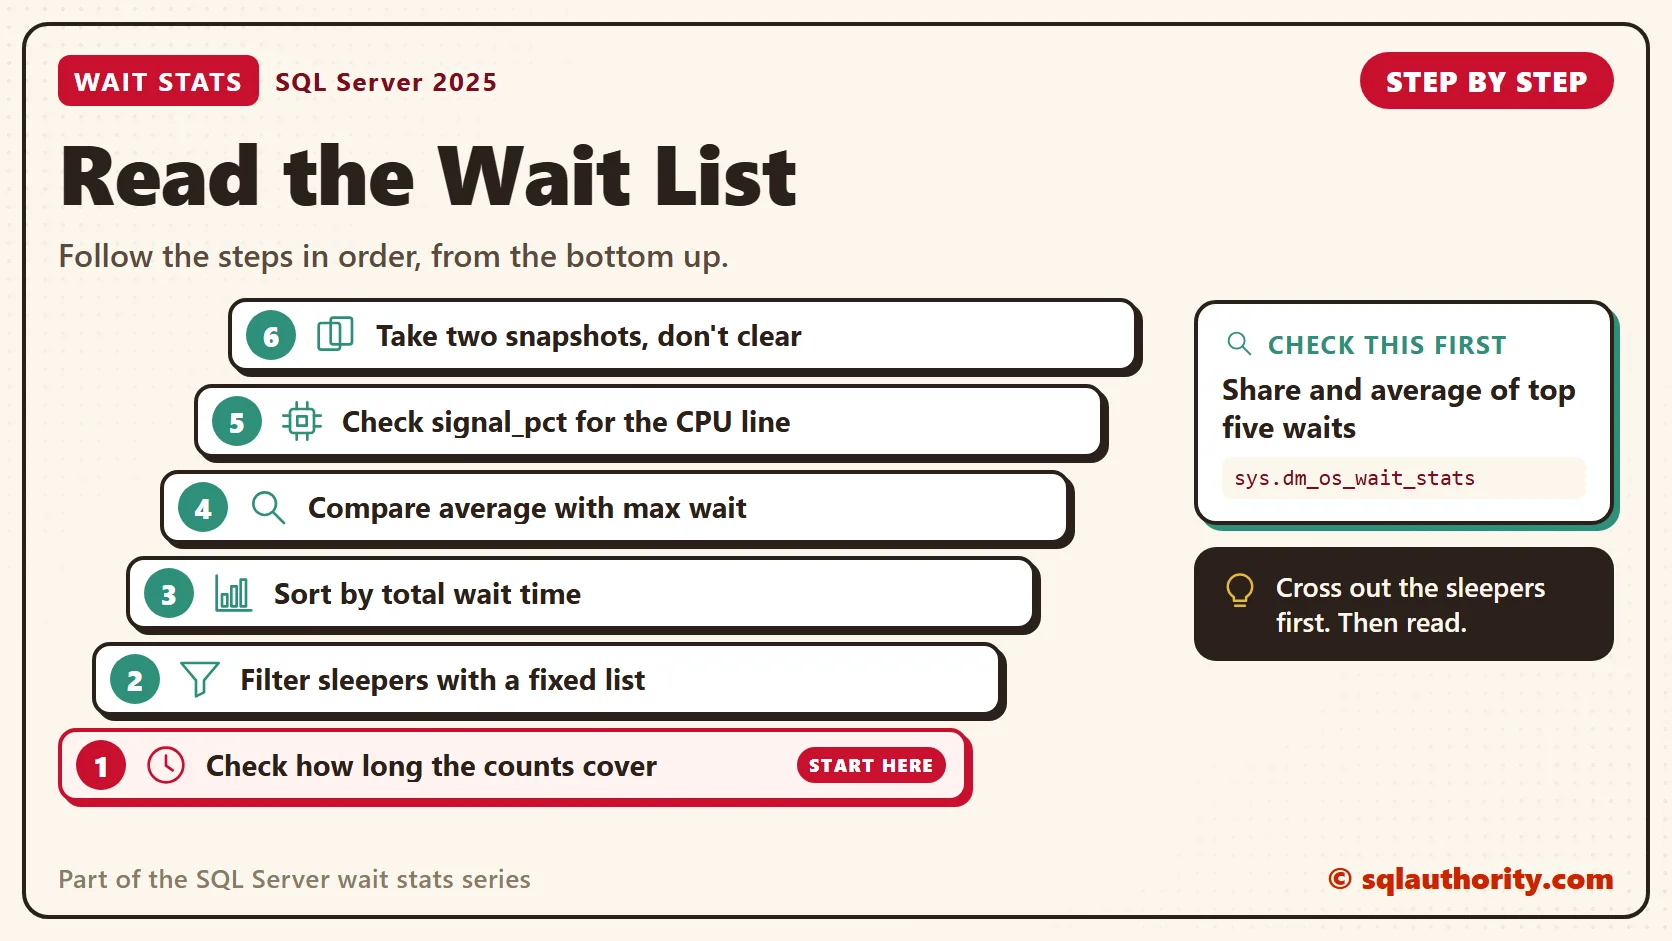
- Check how long the counts cover, with the start time query.
- Filter out the sleepers with the harmless list, and never with a pattern like LIKE N’%SLEEP%’.
- Sort by total wait time and read the top five rows.
- For each one, compare the average with the max before you decide what kind of problem it is.
- Check signal_pct. A high value means the time went to the CPU line, not to the resource.
- Don’t clear the stats to start fresh. Take two snapshots of your busy hour instead.
New in SQL Server 2022 and 2025
The view itself hasn’t changed. Its five columns mean what they always meant. Since SQL Server 2022, reading it needs the VIEW SERVER PERFORMANCE STATE permission.
What keeps changing is the list of wait types, because new features bring new names. The SQL Server 2022 wait list includes CXSYNC_PORT and CXSYNC_CONSUMER, split out of CXPACKET (see CXPACKET Wait Stats). Optimized locking in SQL Server 2025 adds LCK_M_S_XACT_READ, LCK_M_S_XACT_MODIFY and LCK_M_S_XACT. Optimized Locking Wait Stats covers them.
That’s one reason my filter is a fixed list and not a pattern. A new wait type stays visible until someone checks what it is.
Related Reading
- Reading the Top Five Wait Types on Your Server
- Wait Stats Collection Scripts for 2016 and Later Versions
- Top 3 Wait Stats from Real-World
The Clipboard Diner, a wait stats series. Previous: Signal Wait Stats: CPU Waits vs Resource Waits. Next: Live Wait Stats: What Is Waiting Right Now. Every post is listed in the series guide.
Tomorrow brings the Saturday rush, and Casey leaves the clipboard on its hook to walk the line instead.
The wait list is not a to-do list, it is a diary, and the sleepers wrote half of it.
Published by Pinal Dave on SQLAuthority. More of my work at pinaldave.com.
Discover more from SQL Authority with Pinal Dave
Subscribe to get the latest posts sent to your email.




1 Comment. Leave new
Started to read these posts about waits… Congratulations…Very usefull