
Wait stats troubleshooting comes down to one habit: find the top real wait, ask one question, try one fix. This page puts every wait from the series into one chart. It also gives you one query to start with on any server.

This post is part of my wait stats series, told as one story at the Clipboard Diner. Every post is listed in the series guide.
Night 27 at the Clipboard Diner
Sheet-pan night ended at 5:40 AM, with 900 cookies boxed and four bowls washed. Casey slept until noon. When Casey came back, the postcard above the register said what it had said for four weeks. One night left.
At 11 PM, with the Monday bus long gone, Casey spread the whole clipboard across the counter. Twenty-seven nights of times, tally marks and coffee rings. Every kind of waiting the diner knew was in there somewhere.
Casey didn’t want a speech for tomorrow. Casey wanted one page. So Casey ruled three columns on a sheet of butcher paper: what’s on top, the first question, the first fix. Line by line, the month went onto it. The rail. The basement stairs. Booth 7. Pat’s pen. Quinn at table 4.
Kit read it over Casey’s shoulder. “Why not fix everything tonight?” Casey capped the marker. “Because tomorrow I won’t have time to think. I’ll only have time to look.”
Jules pointed at the bottom line. It said: Night baker on top? Cross it out. Read the next one. The whole kitchen laughed, because every one of them had made that mistake.
Casey taped the chart to the fridge and moved the postcard from the register to sit beside it. Then Casey wrote one line on the clipboard: One night left. Look first. Then one fix.
From Top Wait to First Fix
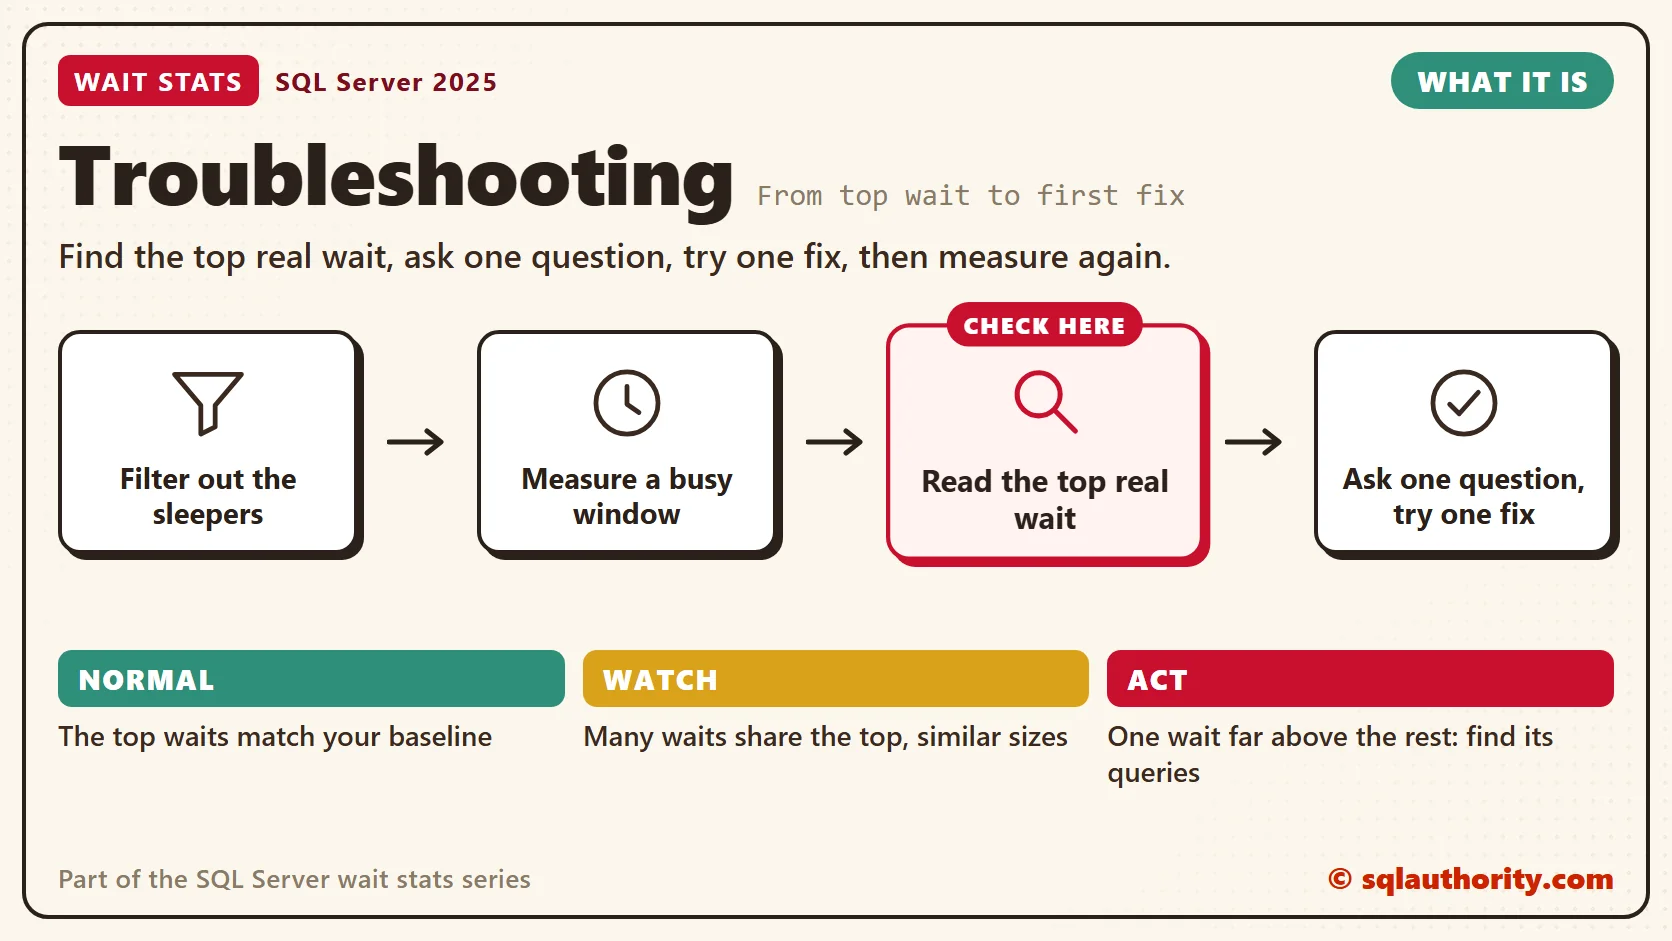
That’s how I troubleshoot waits on a server I’ve never seen. I don’t start with fixes. I start with one filtered list, one top wait and one question.
The order matters. First I remove the background waits that sleep on purpose. Then I measure a busy window, because totals since the last restart blur a bad hour into a good month. Only then do I read the top wait and look it up in the chart below.
The One-Page Chart
| Top wait | First question | First fix | Read |
|---|---|---|---|
| Sleepers such as LAZYWRITER_SLEEP | Is it a background task waiting for work? | Filter it out. | Harmless Wait Stats |
| High signal percent | Are tasks lining up for CPU? | Tune the top CPU queries before adding cores. | Signal Wait Stats |
| SOS_SCHEDULER_YIELD | Which queries burn the most CPU? | Fix those queries. | SOS_SCHEDULER_YIELD Wait Stats |
| CXPACKET, CXCONSUMER | Is a big scan running in parallel, and is the work skewed? | Fix the scan, then set MAXDOP and cost threshold. | CXPACKET Wait Stats, Parallelism Wait Stats |
| PAGEIOLATCH_SH | Too many reads, or slow storage? | Index the top-read queries, then check file latency. | PAGEIOLATCH Wait Stats |
| IO_COMPLETION | Are sorts or hashes spilling to tempdb? | Fix the estimates so grants fit. | IO_COMPLETION Wait Stats |
| ASYNC_IO_COMPLETION | Is a backup or a file growth running? | File growth: turn on instant file initialization. Backups: check read and write speed. | ASYNC_IO_COMPLETION Wait Stats |
| PAGELATCH_EX, PAGELATCH_UP | Which page is hot: a last page or tempdb? | OPTIMIZE_FOR_SEQUENTIAL_KEY or more tempdb files. | PAGELATCH Wait Stats |
| BACKUPIO, BACKUPBUFFER | Is the backup target slow? | Faster target, striping, compression. | BACKUPIO Wait Stats |
| LCK_M_S, LCK_M_U, LCK_M_X | Who is the head blocker, and why is it still open? | Shorten the transaction. RCSI for readers. | LCK_M Wait Stats |
| LCK_M_S_XACT_MODIFY, LCK_M_S_XACT_READ | Which open transaction holds the rows? | Shorten that transaction. | Optimized Locking Wait Stats |
| THREADPOOL | What is holding all the workers? | Fix the blocking or parallelism under it. | THREADPOOL Wait Stats |
| WRITELOG | How fast is the log disk, and how many tiny commits? | Fewer and bigger commits, then faster log storage. | WRITELOG Wait Stats |
| LOGBUFFER | Is WRITELOG high too? | Same fixes as WRITELOG. | LOGBUFFER Wait Stats |
| PREEMPTIVE_OS_* | Which Windows call is it? | Find the feature behind that exact wait. | PREEMPTIVE Wait Stats |
| MSQL_XP | Which extended procedure is running? | Move that work outside SQL Server. | MSQL_XP Wait Stats |
| ASYNC_NETWORK_IO | Is the application reading row by row? | Fetch fewer rows and read them fast. | ASYNC_NETWORK_IO Wait Stats |
| HADR_SYNC_COMMIT | Is the secondary slow, or the network? | Compare it with WRITELOG, then check the secondary’s log disk and the network. | HADR_SYNC_COMMIT Wait Stats |
| OLEDB | Which linked server query, and how many rows? | Filter remotely, or copy the data locally. | OLEDB Wait Stats |
| RESOURCE_SEMAPHORE | Which query holds a giant grant it doesn’t use? | Fix its estimates and wide columns. | RESOURCE_SEMAPHORE Wait Stats |
| HTBUILD, BPSORT | Is it an analytic query, and is it slow? | Leave it, or fix the spill or skew. | Batch Mode Wait Stats |
Normal or a Problem?
| Situation | What it means | What to do |
|---|---|---|
| A sleeper you don’t recognize sits on top | Your filter doesn’t know that background wait yet. | Check it against the harmless list before you filter it. |
| Many waits share the top with similar numbers | No single bottleneck over this window. | Measure a slow hour instead of the whole uptime. |
| One wait stands far above the rest during slow hours | A bottleneck candidate. | Find the slow queries that wait on it, then follow its row in the chart. |
| The top waits match your baseline | This is your normal. | Look at the queries, not the server. |
See It on Your Server
This is the one query I run first. It skips the same 87 harmless waits as the sys.dm_os_wait_stats post. Harmless Wait Stats explains why each one is safe. Run the list and the query together as one batch. Each top wait then gets its share, its average and the post to read next.
-- The harmless list: background housekeeping and deliberate pauses, not user work.
-- why: sleep = sleeps until needed, idle = waits for background work, startup = only at startup,
-- waitfor = asked to wait, broker/ag/trace/qstore/fulltext/xtp/clr = feature housekeeping,
-- internal = internal background task.
DECLARE @harmless TABLE (wait_type nvarchar(60) PRIMARY KEY, why varchar(10) NOT NULL);
INSERT @harmless (wait_type, why) VALUES
    (N'LAZYWRITER_SLEEP', 'sleep'), (N'SLEEP_BPOOL_FLUSH', 'sleep'), (N'SLEEP_TASK', 'sleep'),
    (N'SP_SERVER_DIAGNOSTICS_SLEEP', 'sleep'), (N'CHECKPOINT_QUEUE', 'idle'),
    (N'DIRTY_PAGE_POLL', 'idle'), (N'DISPATCHER_QUEUE_SEMAPHORE', 'idle'),
    (N'KSOURCE_WAKEUP', 'idle'), (N'LOGMGR_QUEUE', 'idle'), (N'ONDEMAND_TASK_QUEUE', 'idle'),
    (N'PREEMPTIVE_SP_SERVER_DIAGNOSTICS', 'idle'), (N'REQUEST_FOR_DEADLOCK_SEARCH', 'idle'),
    (N'RESOURCE_QUEUE', 'idle'), (N'SERVER_IDLE_CHECK', 'idle'), (N'SNI_HTTP_ACCEPT', 'idle'),
    (N'SOS_WORK_DISPATCHER', 'idle'), (N'UCS_SESSION_REGISTRATION', 'idle'),
    (N'VDI_CLIENT_OTHER', 'idle'), (N'CHKPT', 'startup'),
    (N'PWAIT_ALL_COMPONENTS_INITIALIZED', 'startup'), (N'SLEEP_DBSTARTUP', 'startup'),
    (N'SLEEP_DCOMSTARTUP', 'startup'), (N'SLEEP_MASTERDBREADY', 'startup'),
    (N'SLEEP_MASTERMDREADY', 'startup'), (N'SLEEP_MASTERUPGRADED', 'startup'),
    (N'SLEEP_MSDBSTARTUP', 'startup'), (N'SLEEP_PHYSMASTERDBREADY', 'startup'),
    (N'SLEEP_SYSTEMTASK', 'startup'), (N'SLEEP_TEMPDBSTARTUP', 'startup'),
    (N'STARTUP_DEPENDENCY_MANAGER', 'startup'), (N'WAITFOR', 'waitfor'),
    (N'WAITFOR_TASKSHUTDOWN', 'waitfor'), (N'WAIT_FOR_RESULTS', 'waitfor'),
    (N'BROKER_EVENTHANDLER', 'broker'), (N'BROKER_TASK_STOP', 'broker'),
    (N'BROKER_TO_FLUSH', 'broker'), (N'BROKER_TRANSMITTER', 'broker'), (N'DBMIRRORING_CMD', 'ag'),
    (N'DBMIRROR_DBM_EVENT', 'ag'), (N'DBMIRROR_DBM_MUTEX', 'ag'), (N'DBMIRROR_EVENTS_QUEUE', 'ag'),
    (N'DBMIRROR_WORKER_QUEUE', 'ag'), (N'HADR_CLUSAPI_CALL', 'ag'),
    (N'HADR_FILESTREAM_IOMGR_IOCOMPLETION', 'ag'), (N'HADR_LOGCAPTURE_WAIT', 'ag'),
    (N'HADR_NOTIFICATION_DEQUEUE', 'ag'), (N'HADR_TIMER_TASK', 'ag'), (N'HADR_WORK_QUEUE', 'ag'),
    (N'PARALLEL_REDO_DRAIN_WORKER', 'ag'), (N'PARALLEL_REDO_LOG_CACHE', 'ag'),
    (N'PARALLEL_REDO_TRAN_LIST', 'ag'), (N'PARALLEL_REDO_WORKER_SYNC', 'ag'),
    (N'PARALLEL_REDO_WORKER_WAIT_WORK', 'ag'), (N'PREEMPTIVE_HADR_LEASE_MECHANISM', 'ag'),
    (N'REDO_THREAD_PENDING_WORK', 'ag'), (N'PREEMPTIVE_XE_CALLBACKEXECUTE', 'trace'),
    (N'PREEMPTIVE_XE_DISPATCHER', 'trace'), (N'PREEMPTIVE_XE_GETTARGETSTATE', 'trace'),
    (N'PREEMPTIVE_XE_SESSIONCOMMIT', 'trace'), (N'PREEMPTIVE_XE_TARGETFINALIZE', 'trace'),
    (N'PREEMPTIVE_XE_TARGETINIT', 'trace'), (N'SQLTRACE_BUFFER_FLUSH', 'trace'),
    (N'SQLTRACE_INCREMENTAL_FLUSH_SLEEP', 'trace'), (N'SQLTRACE_WAIT_ENTRIES', 'trace'),
    (N'XE_BUFFERMGR_ALLPROCESSED_EVENT', 'trace'), (N'XE_DISPATCHER_JOIN', 'trace'),
    (N'XE_DISPATCHER_WAIT', 'trace'), (N'XE_LIVE_TARGET_TVF', 'trace'),
    (N'XE_TIMER_EVENT', 'trace'), (N'QDS_ASYNC_QUEUE', 'qstore'),
    (N'QDS_CLEANUP_STALE_QUERIES_TASK_MAIN_LOOP_SLEEP', 'qstore'),
    (N'QDS_PERSIST_TASK_MAIN_LOOP_SLEEP', 'qstore'), (N'QDS_SHUTDOWN_QUEUE', 'qstore'),
    (N'FT_IFTSHC_MUTEX', 'fulltext'), (N'FT_IFTSISM_MUTEX', 'fulltext'),
    (N'FT_IFTS_SCHEDULER_IDLE_WAIT', 'fulltext'), (N'WAIT_XTP_CKPT_CLOSE', 'xtp'),
    (N'WAIT_XTP_HOST_WAIT', 'xtp'), (N'WAIT_XTP_OFFLINE_CKPT_NEW_LOG', 'xtp'),
    (N'WAIT_XTP_RECOVERY', 'xtp'), (N'CLR_AUTO_EVENT', 'clr'),
    (N'AZURE_IMDS_VERSIONS', 'internal'), (N'POPULATE_LOCK_ORDINALS', 'internal'),
    (N'PVS_PREALLOCATE', 'internal'), (N'PWAIT_DIRECTLOGCONSUMER_GETNEXT', 'internal'),
    (N'PWAIT_EXTENSIBILITY_CLEANUP_TASK', 'internal'), (N'SOS_WORKER_MIGRATION', 'internal');

-- Where do I start? Top real waits since the last restart, each with the post to read.
-- Run it in the same batch as the list above.
SELECT TOP (10)
       w.wait_type,
       CAST(w.wait_time_ms / 1000.0 AS decimal(18,1)) AS waited_sec,
       CAST(100.0 * w.wait_time_ms / NULLIF(SUM(w.wait_time_ms) OVER (), 0) AS decimal(5,1)) AS share_pct,
       CAST(1.0 * w.wait_time_ms / NULLIF(w.waiting_tasks_count, 0) AS decimal(18,1)) AS avg_wait_ms,
       CAST(100.0 * w.signal_wait_time_ms / NULLIF(w.wait_time_ms, 0) AS decimal(5,1)) AS signal_pct,
       CASE
           WHEN w.wait_type LIKE N'LCK[_]M[_]%XACT%' THEN N'Optimized Locking Wait Stats'
           WHEN w.wait_type LIKE N'LCK[_]M[_]%' THEN N'LCK_M Wait Stats'
           WHEN w.wait_type LIKE N'PAGEIOLATCH[_]%' THEN N'PAGEIOLATCH Wait Stats'
           WHEN w.wait_type LIKE N'PAGELATCH[_]%' THEN N'PAGELATCH Wait Stats'
           WHEN w.wait_type LIKE N'CX%' THEN N'CXPACKET Wait Stats'
           WHEN w.wait_type LIKE N'PREEMPTIVE[_]%' THEN N'PREEMPTIVE Wait Stats'
           WHEN w.wait_type LIKE N'BACKUP%' THEN N'BACKUPIO Wait Stats'
           WHEN w.wait_type LIKE N'RESOURCE[_]SEMAPHORE%' THEN N'RESOURCE_SEMAPHORE Wait Stats'
           WHEN w.wait_type LIKE N'HT[BDMR]%' OR w.wait_type = N'BPSORT' THEN N'Batch Mode Wait Stats'
           WHEN w.wait_type IN (N'SOS_SCHEDULER_YIELD', N'IO_COMPLETION', N'ASYNC_IO_COMPLETION',
                                N'THREADPOOL', N'WRITELOG', N'LOGBUFFER', N'MSQL_XP',
                                N'ASYNC_NETWORK_IO', N'HADR_SYNC_COMMIT', N'OLEDB')
               THEN w.wait_type + N' Wait Stats'
           ELSE N'Harmless Wait Stats (is it a sleeper?)'
       END AS read_this
FROM sys.dm_os_wait_stats AS w
WHERE w.waiting_tasks_count > 0
  AND NOT EXISTS (SELECT 1 FROM @harmless AS h WHERE h.wait_type = w.wait_type COLLATE DATABASE_DEFAULT)
ORDER BY w.wait_time_ms DESC;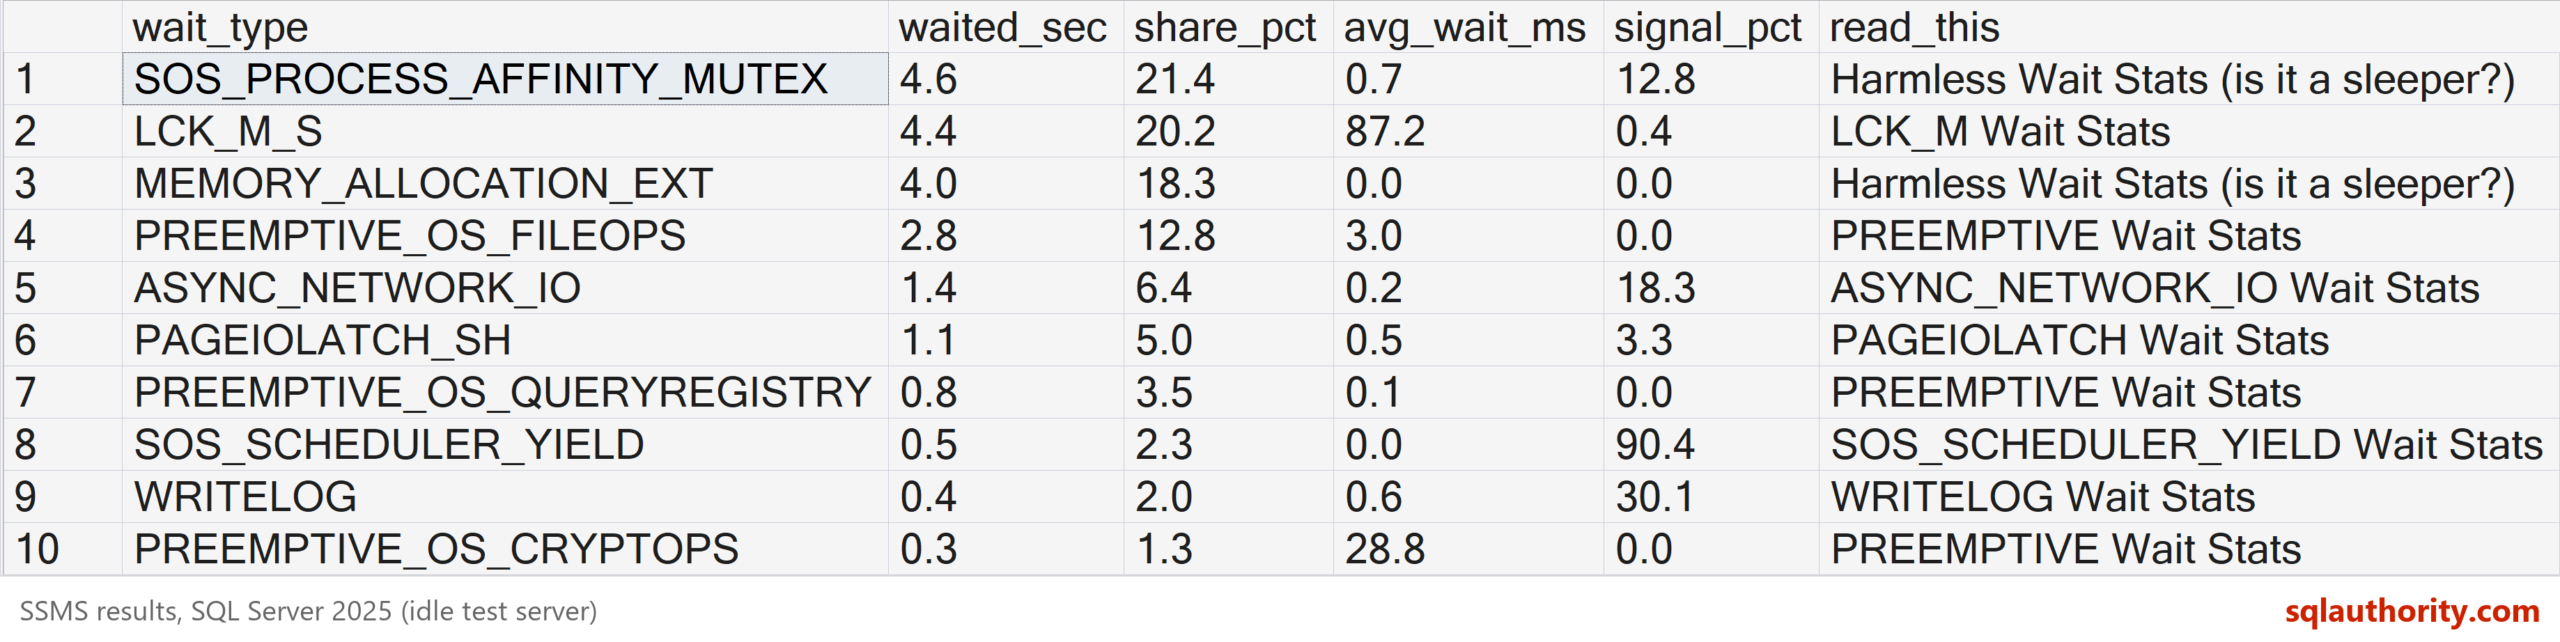
Here’s the query on my idle test server. Two waits that aren’t on the chart sit near the top, and read_this sends both to the harmless check. LCK_M_S has only 50 waits in total, so on this server it’s no emergency.
Read share_pct first. It tells you how much of the server’s real waiting each wait type owns. The top one or two rows are where your time goes. The read_this column names the post for that wait, and its row in the chart holds the first question.
Then check avg_wait_ms. A thousand waits of 2 ms and two waits of one second add up to the same waited_sec. The first is a busy line, the second is a stall. The signal_pct column is the part of each wait spent in line for a CPU. When it’s high on most top rows, start with the CPU rows.
These totals run since the last restart. For a slow hour, take two readings and subtract, as Wait Stats Over Time shows.
Fix It
It’s tempting to fix the top three waits at once. The server gets faster, and nobody knows which change helped. When it slows down again a month later, you start from zero. That’s why I change one thing at a time.
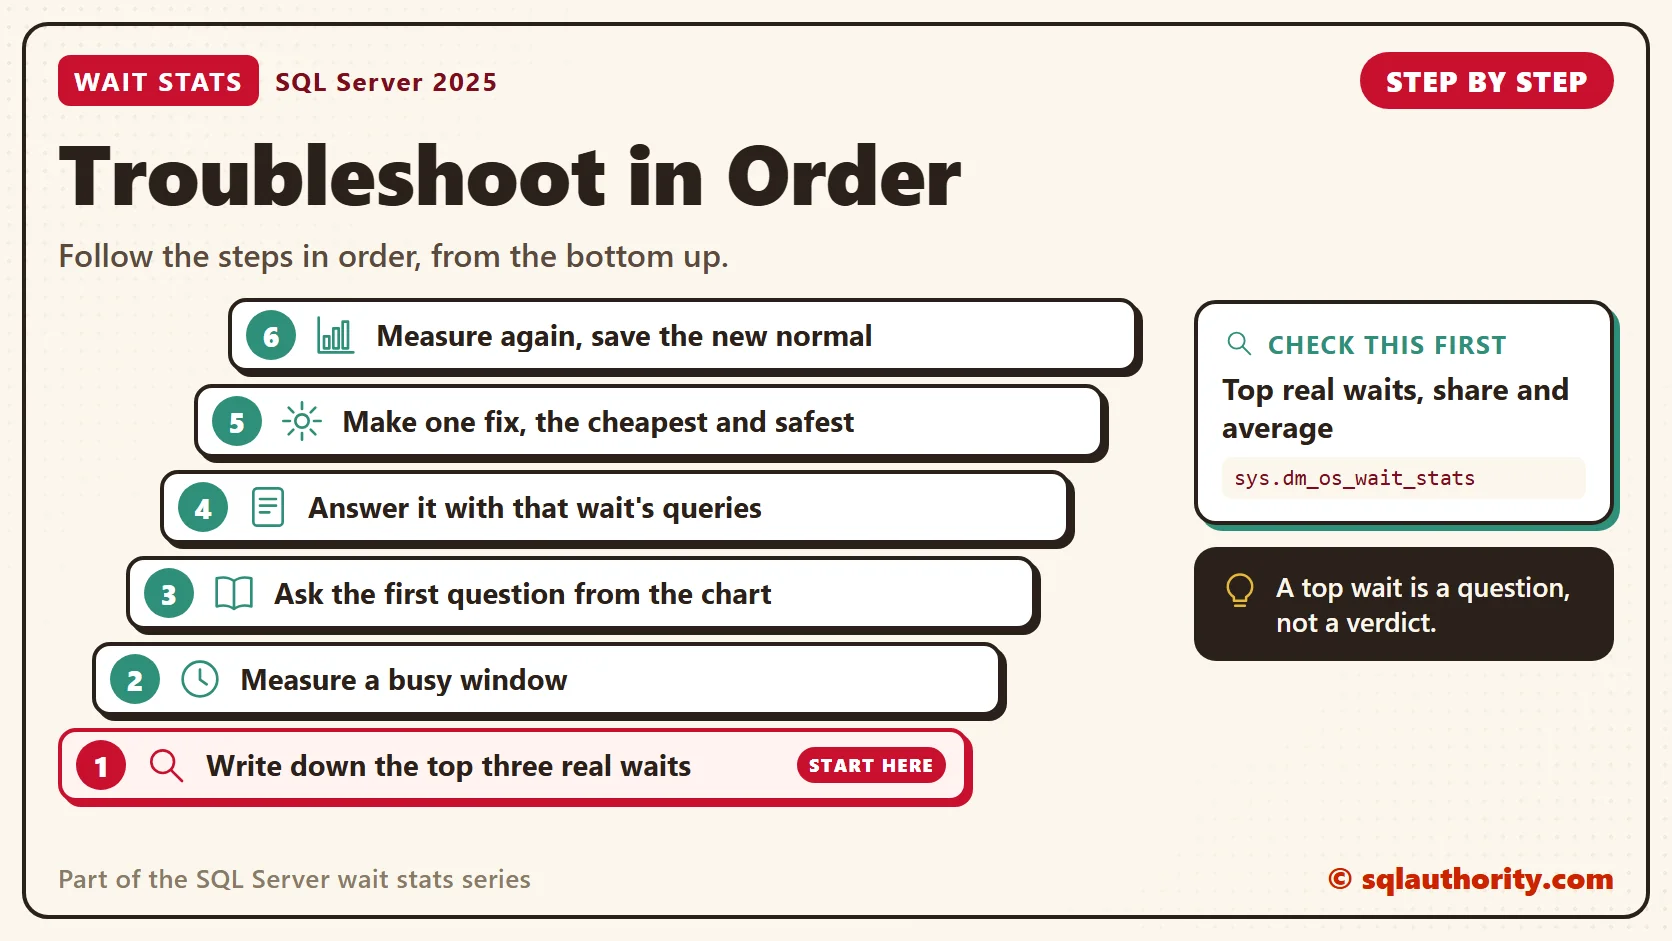
- Run the query above, and write down the top three real waits.
- Measure a busy window, so a bad hour isn’t hidden inside a quiet month.
- Take the top wait, and ask the first question from its row in the chart.
- Answer it with that wait’s own queries, before you change anything.
- Make one fix, the cheapest and safest one.
- Measure the same window again, and compare.
- Save the new numbers as your normal.
You could say a real server is too messy for a one-page chart. Fair point. Some waits travel together, like WRITELOG with LOGBUFFER, or CXPACKET with PAGEIOLATCH from one big scan. When they do, start with the wait that causes the other. The chart still tells you where to look first.
New in SQL Server 2022 and 2025
Three changes touch this chart. SQL Server 2025 adds the LCK_M_S_XACT waits when optimized locking is on, so they now have a row. It also turns DOP feedback on by default in Enterprise and Enterprise Developer editions. It needs compatibility level 160 or higher and Query Store in READ_WRITE mode. That can lower parallel waits for repeating queries. Since SQL Server 2022, Query Store is on by default for new databases. It shows which queries spent time in each wait category.
SQL Server 2025 also adds OPTIMIZED_SP_EXECUTESQL, which calms compile storms behind RESOURCE_SEMAPHORE_QUERY_COMPILE. I keep these and many more tested queries in my SQL Server 2025 cheat sheet.
Related Reading
The Clipboard Diner, a wait stats series. Previous: Batch Mode Wait Stats: HTBUILD and Columnstore Waits. Next: Wait Stats Summary: Every Wait on One Page. Every post is listed in the series guide.
Tomorrow is a Tuesday, and the critic from the county paper finally walks in.
A top wait is not a verdict, it is the first question to ask.
Published by Pinal Dave on SQLAuthority. More of my work at pinaldave.com.
Discover more from SQL Authority with Pinal Dave
Subscribe to get the latest posts sent to your email.



4 Comments. Leave new
Hi pinaldave! Unique article and good content. There is little question that excellent, genuine article content determined by insight in addition to information of the topic is the thing that everyone seems to be looking for however, over the internet, is usually the hardest thing to get. Kudos for your own engagement and perspective.
Thanks from Spain, I´m looking for a reference like that. It´s a great help.