
Harmless wait stats come from background tasks that sleep on purpose, waiting for work or for a timer. They grow every hour your server is up, busy or not. Filter them out, and the waits that hurt your users rise to the top.

This post is part of my wait stats series, told as one story at the Clipboard Diner. Every post is listed in the series guide.
Night 13 at the Clipboard Diner
After last night’s elbow fight over one notepad, Night 13 was calm once the Monday bus pulled out. Thirteen nights down, fifteen to go, close enough to halfway for a slice of cherry pie.
At 2 AM Casey added up the clipboard, and the three biggest numbers were old friends. The night baker: waiting, nine hours. The dishwasher: six hours. The jukebox, between songs: four hours.
In the back, the night baker slept on a cot by the flour bins, alarm set for 4 AM. The dishwasher stood by an empty sink, waiting for the next tray. The jukebox sat dark on its timer.
Not one plate had waited on any of them. The baker would sleep nine hours on a slow Tuesday or a packed Saturday. Those numbers grew with the clock, not with the crowd.
Casey almost tore the lines off the page, then stopped. An idle dishwasher is fine, but one who stands still while dirty trays pile up is a different story. So Casey drew a line under the three and wrote: If no plate waits on it, it’s not the problem.
What Makes a Wait Harmless
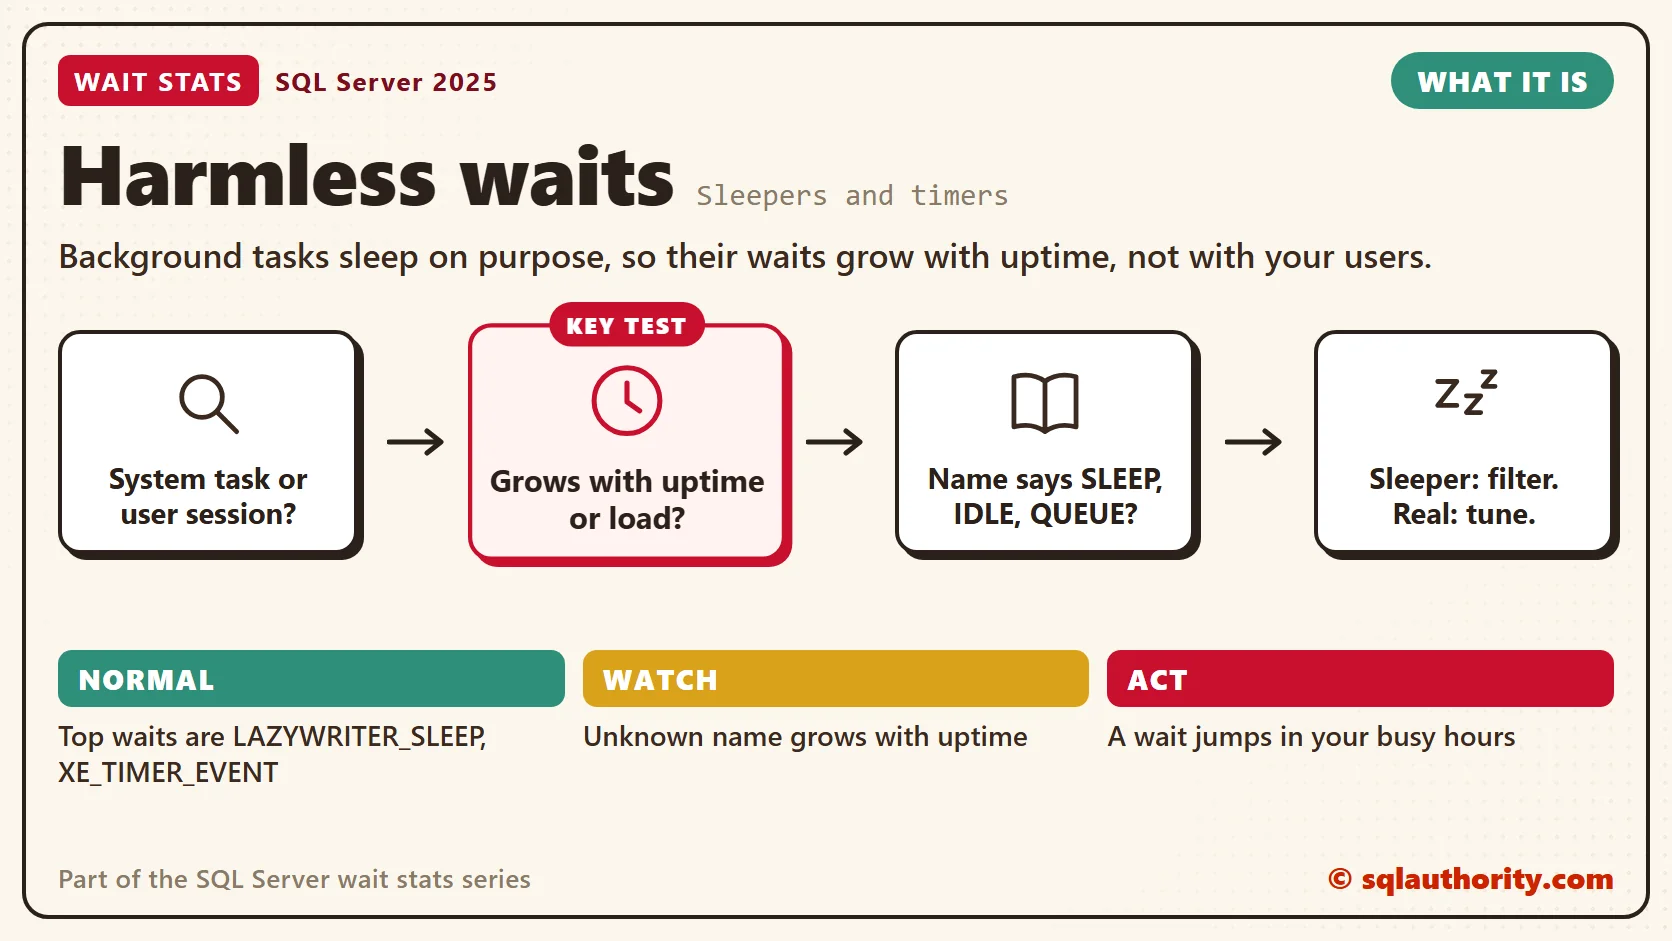
SQL Server works the same way. Dozens of background tasks wake up, check for work, do a little, and go back to sleep. Every sleep is written down as a wait.
Here are the sleepers I meet most, with their diner twins.
- LAZYWRITER_SLEEP: the lazy writer resting between checks for free memory. That’s the night baker.
- CHECKPOINT_QUEUE and LOGMGR_QUEUE: the checkpoint and log writer tasks waiting for work. That’s the dishwasher by an empty sink.
- REQUEST_FOR_DEADLOCK_SEARCH: the deadlock monitor waiting until its next look around.
- XE_TIMER_EVENT and SQLTRACE_INCREMENTAL_FLUSH_SLEEP: timers. That’s the jukebox.
- FT_IFTS_SCHEDULER_IDLE_WAIT: the full-text scheduler with nothing to do. The name says IDLE, so don’t spend a morning checking full-text indexes.
- WAITFOR: code that asked to wait, such as WAITFOR DELAY in a job. Check that it doesn’t wait inside a transaction that holds locks.
- Housekeeping loops for Service Broker, availability groups and Query Store, such as BROKER_TO_FLUSH, HADR_TIMER_TASK and QDS_ASYNC_QUEUE. Read the full name, though. HADR_SYNC_COMMIT is a real commit wait.
Sleeper or Real Wait?
You’ll meet wait names that aren’t on any list. I judge them with three tests.
Who waits on it? If a user session waits on it during your slow hour, it isn’t harmless, whatever its name says.
What makes it grow? A sleeper grows with uptime. A real wait jumps when users are busy.
What does the documentation say? Search the exact name in Microsoft’s list of wait types. Words like SLEEP, IDLE, QUEUE and TIMER are a strong hint.
Treat the tests as clues, not proof. A steady wait can still hurt, and a background wait can hold up a feature, such as availability group redo.
You could say a big, boring wait belongs out of sight. Fair point, it cleans up the chart. But a filter takes a wait out of your view, and a hidden wait is easy to forget. Check that no work waits behind it, and keep the raw numbers one query away.
Waits I Keep Visible on Purpose
Some popular scripts hide these waits too. I leave them visible, because each one can belong to a user’s query or hold up real work.
- CXCONSUMER: a parallel consumer waiting for rows. A steady trickle is normal, but a jump can mean parallel work split unevenly. See CXPACKET Wait Stats.
- MEMORY_ALLOCATION_EXT: a task getting memory. It grows with real allocation work, so it rises and falls with your load.
- EXECSYNC: the threads of a parallel or batch mode query lining up on shared work. A user query is the one waiting.
- HTBUILD and HTDELETE: batch mode hash tables being built and cleaned up. That’s query work, covered in Batch Mode Wait Stats.
- Every PREEMPTIVE_OS_ wait: a call into Windows that can be a real stall. WRITEFILEGATHER is file zeroing, and AUTHENTICATIONOPS is slow logins. Find the exact one in PREEMPTIVE Wait Stats.
- BROKER_RECEIVE_WAITFOR: a RECEIVE statement waiting for Service Broker messages. When messages should be arriving, a long wait here is your clue.
- FSAGENT: FILESTREAM file work waiting behind other FILESTREAM file work. On a FILESTREAM server, that’s real contention.
- CLR_MANUAL_EVENT and CLR_SEMAPHORE: CLR code waiting on an event or a semaphore. A user’s CLR procedure can be the one waiting.
- PARALLEL_REDO_TRAN_TURN: redo threads on a secondary replica waiting their turn on a transaction. When a secondary falls behind, this wait can show why.
ASYNC_IO_COMPLETION stays visible too. A backup in your busy hour matters (see ASYNC_IO_COMPLETION Wait Stats).
My list is for the everyday top-waits view. Chasing one feature is different. For availability group redo, checkpoint I/O, In-Memory OLTP or FILESTREAM, read that feature’s raw waits too. Run the queries with or without the list. A wait that’s background noise on most days can be the whole story for that feature.
Normal or a Problem?
| Situation | What it means | What to do |
|---|---|---|
| The top waits are LAZYWRITER_SLEEP or XE_TIMER_EVENT | Normal. Background tasks resting. | Filter them. |
| FT_IFTS_SCHEDULER_IDLE_WAIT is large | The full-text scheduler is idle. | Filter it. If search feels slow, read the search query’s own waits. |
| WAITFOR is large | Some code waits on purpose. | Find the batch. Hide it only when it holds no locks and delays no user. |
| A wait jumps during your busy hours | Not harmless, even with a sleepy name. | Find its post in this series. |
See It on Your Server
My harmless list is a table variable of 87 waits, each with a why code such as sleep or idle. It covers the common background waits, not every wait SQL Server has. Some names are documented only as internal, or not at all. Queries skip the list with NOT EXISTS, so run the block as one batch.
SLEEP_TASK sits in the list, though some tuners keep it visible. It’s a general event wait, and on the servers I check, background tasks own nearly all of it. If it climbs in your busy hour, see who waits on it with the query further down.
-- The harmless list: background housekeeping and deliberate pauses, not user work.
-- why: sleep = sleeps until needed, idle = waits for background work, startup = only at startup,
-- waitfor = asked to wait, broker/ag/trace/qstore/fulltext/xtp/clr = feature housekeeping,
-- internal = internal background task.
DECLARE @harmless TABLE (wait_type nvarchar(60) PRIMARY KEY, why varchar(10) NOT NULL);
INSERT @harmless (wait_type, why) VALUES
    (N'LAZYWRITER_SLEEP', 'sleep'), (N'SLEEP_BPOOL_FLUSH', 'sleep'), (N'SLEEP_TASK', 'sleep'),
    (N'SP_SERVER_DIAGNOSTICS_SLEEP', 'sleep'), (N'CHECKPOINT_QUEUE', 'idle'),
    (N'DIRTY_PAGE_POLL', 'idle'), (N'DISPATCHER_QUEUE_SEMAPHORE', 'idle'),
    (N'KSOURCE_WAKEUP', 'idle'), (N'LOGMGR_QUEUE', 'idle'), (N'ONDEMAND_TASK_QUEUE', 'idle'),
    (N'PREEMPTIVE_SP_SERVER_DIAGNOSTICS', 'idle'), (N'REQUEST_FOR_DEADLOCK_SEARCH', 'idle'),
    (N'RESOURCE_QUEUE', 'idle'), (N'SERVER_IDLE_CHECK', 'idle'), (N'SNI_HTTP_ACCEPT', 'idle'),
    (N'SOS_WORK_DISPATCHER', 'idle'), (N'UCS_SESSION_REGISTRATION', 'idle'),
    (N'VDI_CLIENT_OTHER', 'idle'), (N'CHKPT', 'startup'),
    (N'PWAIT_ALL_COMPONENTS_INITIALIZED', 'startup'), (N'SLEEP_DBSTARTUP', 'startup'),
    (N'SLEEP_DCOMSTARTUP', 'startup'), (N'SLEEP_MASTERDBREADY', 'startup'),
    (N'SLEEP_MASTERMDREADY', 'startup'), (N'SLEEP_MASTERUPGRADED', 'startup'),
    (N'SLEEP_MSDBSTARTUP', 'startup'), (N'SLEEP_PHYSMASTERDBREADY', 'startup'),
    (N'SLEEP_SYSTEMTASK', 'startup'), (N'SLEEP_TEMPDBSTARTUP', 'startup'),
    (N'STARTUP_DEPENDENCY_MANAGER', 'startup'), (N'WAITFOR', 'waitfor'),
    (N'WAITFOR_TASKSHUTDOWN', 'waitfor'), (N'WAIT_FOR_RESULTS', 'waitfor'),
    (N'BROKER_EVENTHANDLER', 'broker'), (N'BROKER_TASK_STOP', 'broker'),
    (N'BROKER_TO_FLUSH', 'broker'), (N'BROKER_TRANSMITTER', 'broker'), (N'DBMIRRORING_CMD', 'ag'),
    (N'DBMIRROR_DBM_EVENT', 'ag'), (N'DBMIRROR_DBM_MUTEX', 'ag'), (N'DBMIRROR_EVENTS_QUEUE', 'ag'),
    (N'DBMIRROR_WORKER_QUEUE', 'ag'), (N'HADR_CLUSAPI_CALL', 'ag'),
    (N'HADR_FILESTREAM_IOMGR_IOCOMPLETION', 'ag'), (N'HADR_LOGCAPTURE_WAIT', 'ag'),
    (N'HADR_NOTIFICATION_DEQUEUE', 'ag'), (N'HADR_TIMER_TASK', 'ag'), (N'HADR_WORK_QUEUE', 'ag'),
    (N'PARALLEL_REDO_DRAIN_WORKER', 'ag'), (N'PARALLEL_REDO_LOG_CACHE', 'ag'),
    (N'PARALLEL_REDO_TRAN_LIST', 'ag'), (N'PARALLEL_REDO_WORKER_SYNC', 'ag'),
    (N'PARALLEL_REDO_WORKER_WAIT_WORK', 'ag'), (N'PREEMPTIVE_HADR_LEASE_MECHANISM', 'ag'),
    (N'REDO_THREAD_PENDING_WORK', 'ag'), (N'PREEMPTIVE_XE_CALLBACKEXECUTE', 'trace'),
    (N'PREEMPTIVE_XE_DISPATCHER', 'trace'), (N'PREEMPTIVE_XE_GETTARGETSTATE', 'trace'),
    (N'PREEMPTIVE_XE_SESSIONCOMMIT', 'trace'), (N'PREEMPTIVE_XE_TARGETFINALIZE', 'trace'),
    (N'PREEMPTIVE_XE_TARGETINIT', 'trace'), (N'SQLTRACE_BUFFER_FLUSH', 'trace'),
    (N'SQLTRACE_INCREMENTAL_FLUSH_SLEEP', 'trace'), (N'SQLTRACE_WAIT_ENTRIES', 'trace'),
    (N'XE_BUFFERMGR_ALLPROCESSED_EVENT', 'trace'), (N'XE_DISPATCHER_JOIN', 'trace'),
    (N'XE_DISPATCHER_WAIT', 'trace'), (N'XE_LIVE_TARGET_TVF', 'trace'),
    (N'XE_TIMER_EVENT', 'trace'), (N'QDS_ASYNC_QUEUE', 'qstore'),
    (N'QDS_CLEANUP_STALE_QUERIES_TASK_MAIN_LOOP_SLEEP', 'qstore'),
    (N'QDS_PERSIST_TASK_MAIN_LOOP_SLEEP', 'qstore'), (N'QDS_SHUTDOWN_QUEUE', 'qstore'),
    (N'FT_IFTSHC_MUTEX', 'fulltext'), (N'FT_IFTSISM_MUTEX', 'fulltext'),
    (N'FT_IFTS_SCHEDULER_IDLE_WAIT', 'fulltext'), (N'WAIT_XTP_CKPT_CLOSE', 'xtp'),
    (N'WAIT_XTP_HOST_WAIT', 'xtp'), (N'WAIT_XTP_OFFLINE_CKPT_NEW_LOG', 'xtp'),
    (N'WAIT_XTP_RECOVERY', 'xtp'), (N'CLR_AUTO_EVENT', 'clr'),
    (N'AZURE_IMDS_VERSIONS', 'internal'), (N'POPULATE_LOCK_ORDINALS', 'internal'),
    (N'PVS_PREALLOCATE', 'internal'), (N'PWAIT_DIRECTLOGCONSUMER_GETNEXT', 'internal'),
    (N'PWAIT_EXTENSIBILITY_CLEANUP_TASK', 'internal'), (N'SOS_WORKER_MIGRATION', 'internal');

-- How much of all wait time does the harmless list cover, by why code?
SELECT IIF(GROUPING(h.why) = 1, 'ALL HARMLESS', h.why) AS why,
       COUNT(*) AS wait_types_found,
       CAST(SUM(w.wait_time_ms) / 1000.0 AS decimal(18, 1)) AS waited_sec,
       CAST(100.0 * SUM(w.wait_time_ms) / NULLIF(MAX(t.all_ms), 0) AS decimal(5, 2)) AS share_pct
FROM sys.dm_os_wait_stats AS w
JOIN @harmless AS h
    ON h.wait_type = w.wait_type COLLATE DATABASE_DEFAULT
CROSS JOIN (SELECT SUM(wait_time_ms) AS all_ms FROM sys.dm_os_wait_stats) AS t
GROUP BY ROLLUP (h.why)
ORDER BY GROUPING(h.why) DESC, share_pct DESC;

-- What is left: the 15 biggest waits the list does not cover
SELECT TOP (15)
       w.wait_type,
       CAST(w.wait_time_ms / 1000.0 AS decimal(18, 1)) AS waited_sec,
       CAST(100.0 * w.wait_time_ms / NULLIF(t.all_ms, 0) AS decimal(5, 2)) AS share_pct,
       CAST(1.0 * w.wait_time_ms / NULLIF(w.waiting_tasks_count, 0) AS decimal(12, 1)) AS avg_wait_ms,
       CAST(100.0 * w.signal_wait_time_ms / NULLIF(w.wait_time_ms, 0) AS decimal(5, 1)) AS signal_pct
FROM sys.dm_os_wait_stats AS w
CROSS JOIN (SELECT SUM(wait_time_ms) AS all_ms FROM sys.dm_os_wait_stats) AS t
WHERE NOT EXISTS (SELECT 1 FROM @harmless AS h WHERE h.wait_type = w.wait_type COLLATE DATABASE_DEFAULT)
  AND w.wait_time_ms > 0
ORDER BY w.wait_time_ms DESC;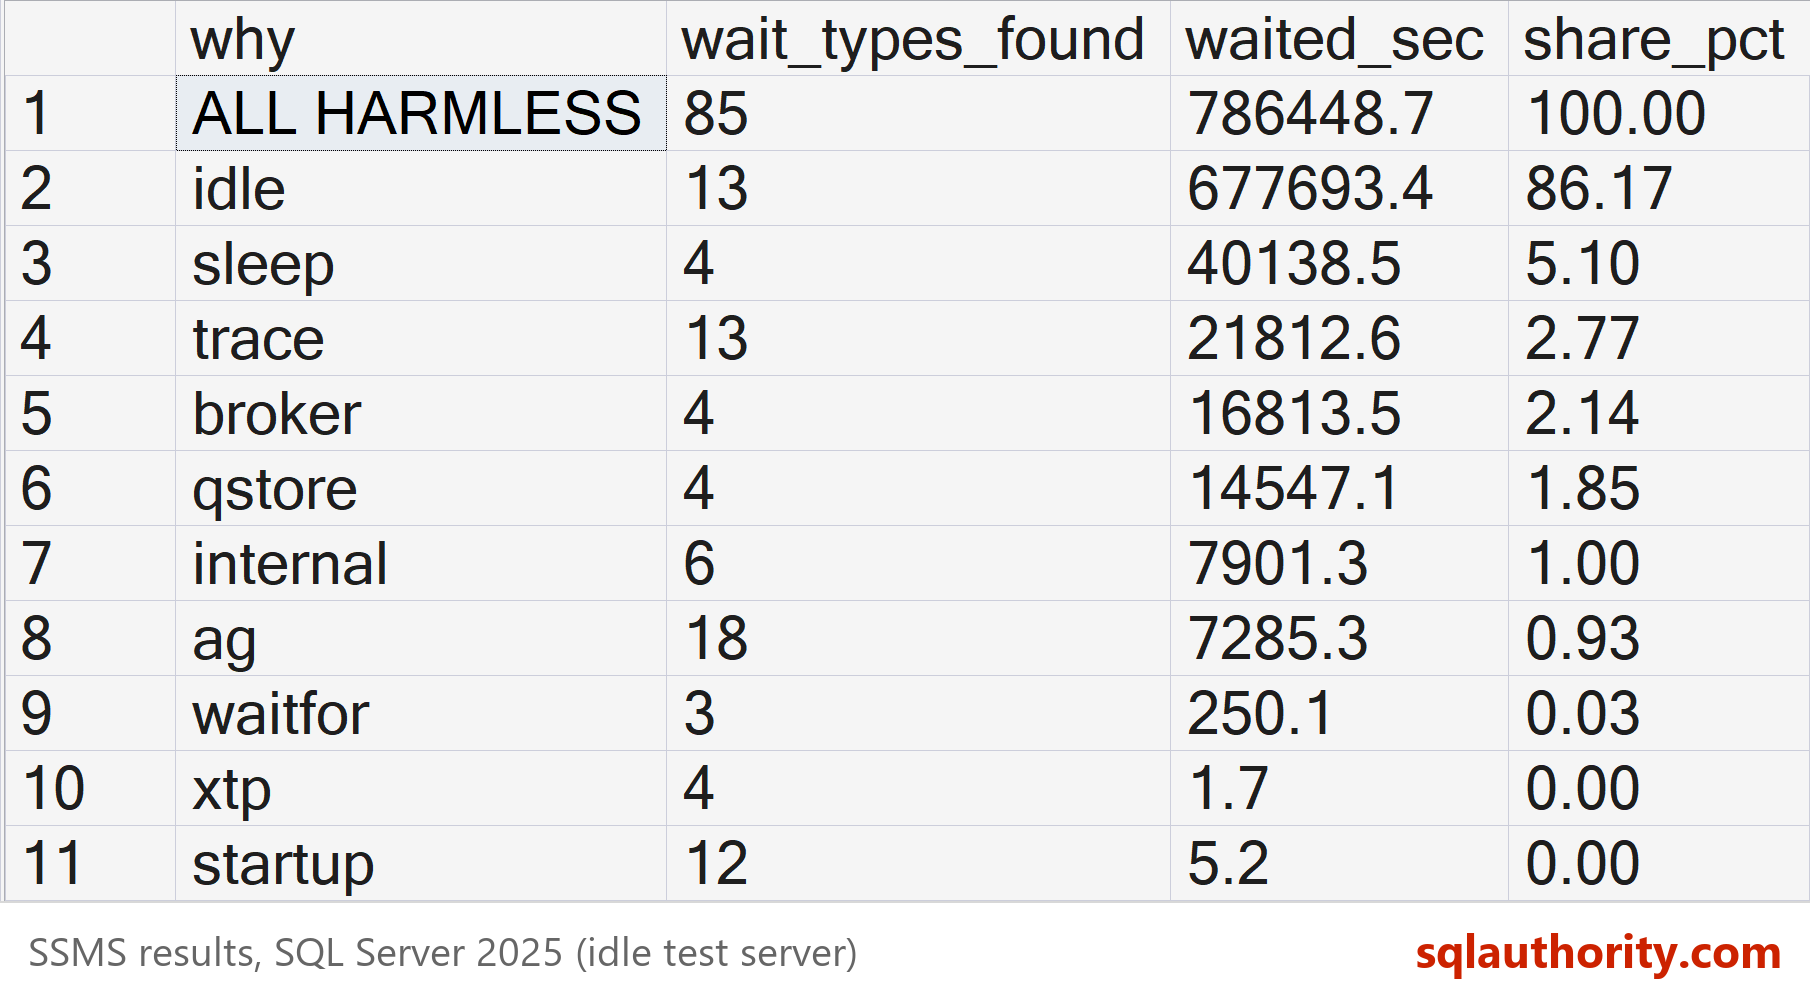
Here’s the first result on my idle test server, showing 11 of its 13 rows. The ALL HARMLESS row rounds to 100.00 percent, and 85 of the 87 listed waits showed up. With no users, nearly all the waiting is housekeeping.
In the first result, the ALL HARMLESS row is the sleepers’ share of all wait time. On most servers I check, it’s the biggest part. The second result is where real work starts, and its share_pct uses the same total.
The next block judges one unknown wait. Put its name in the first line.
DECLARE @wait nvarchar(60) = N'FT_IFTS_SCHEDULER_IDLE_WAIT';
-- Does it grow with the clock?
SELECT ws.wait_type,
       ws.waiting_tasks_count,
       ws.wait_time_ms,
       DATEDIFF(SECOND, si.sqlserver_start_time, SYSDATETIME()) AS uptime_sec,
       CAST(ws.wait_time_ms / 1000.0
            / NULLIF(DATEDIFF(SECOND, si.sqlserver_start_time, SYSDATETIME()), 0)
            AS decimal(10, 2)) AS waited_sec_per_uptime_sec
FROM sys.dm_os_wait_stats AS ws
CROSS JOIN sys.dm_os_sys_info AS si
WHERE ws.wait_type = @wait;

-- Who waits on it right now? (is_user_process 0 = system session, NULL = no session row)
SELECT wt.session_id,
       s.is_user_process,
       wt.wait_type,
       wt.wait_duration_ms
FROM sys.dm_os_waiting_tasks AS wt
LEFT JOIN sys.dm_exec_sessions AS s
    ON s.session_id = wt.session_id
WHERE wt.wait_type = @wait
ORDER BY wt.wait_duration_ms DESC;
Totals since restart move slowly after weeks of uptime, and the ratio is off if someone cleared the counters. So run the first query at the start and end of a busy hour, then of a quiet hour. A sleeper grows by about the same amount both times, with only system tasks waiting. A bigger busy-hour jump or a user session means a real wait.
Fix It
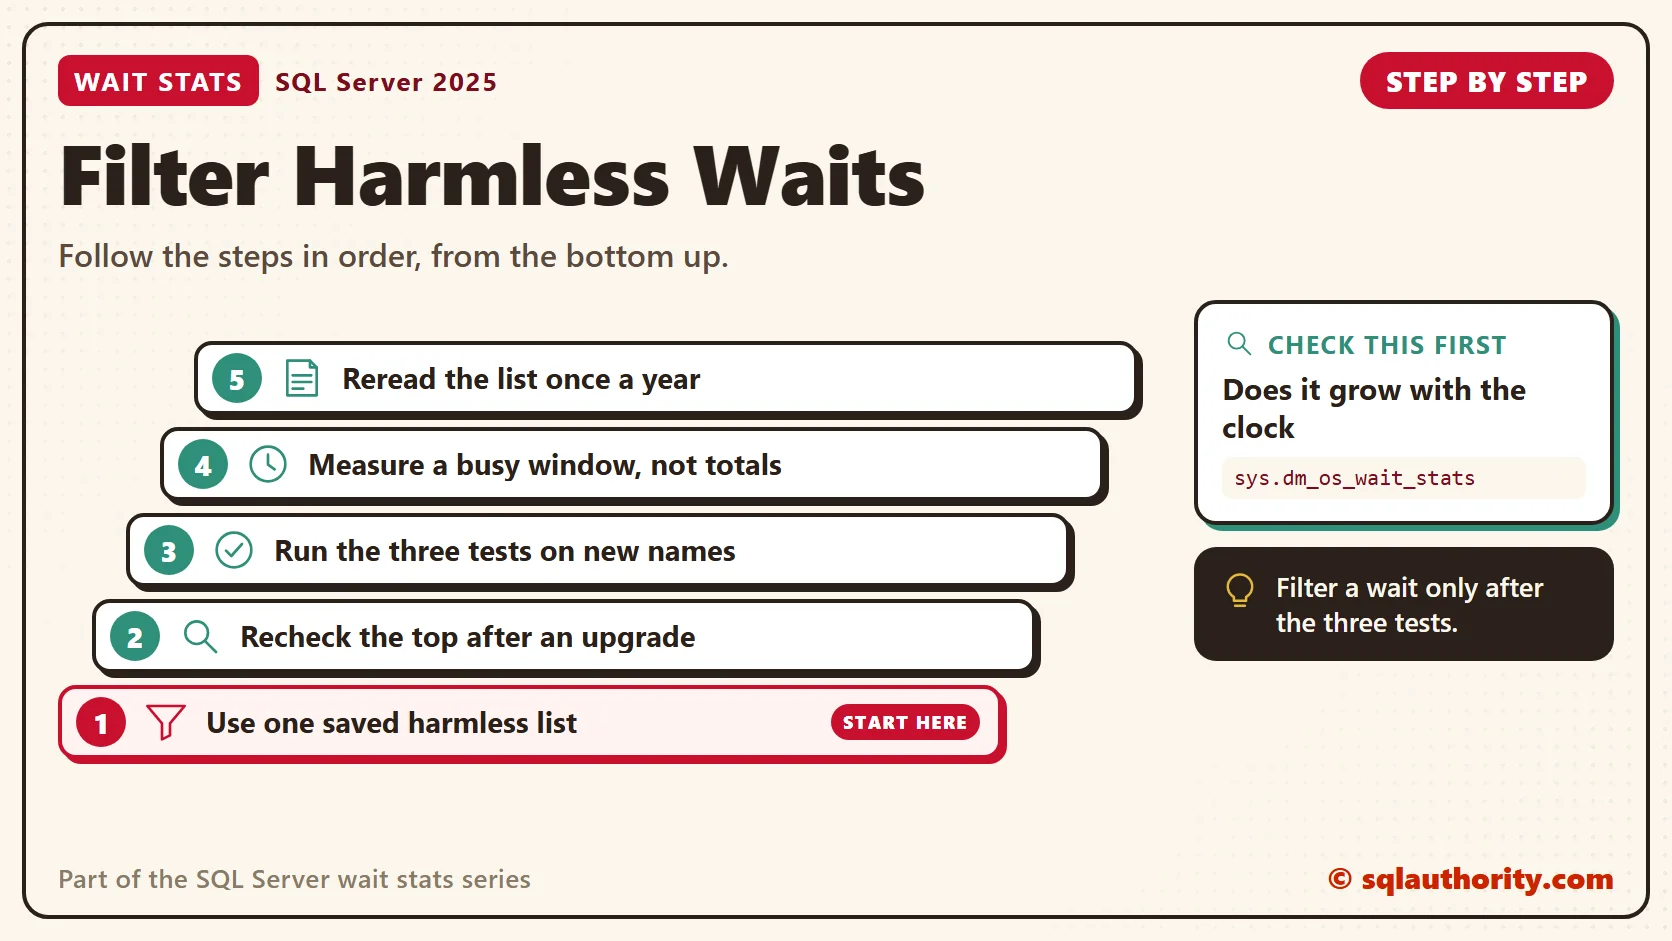
There’s nothing to fix in the sleepers themselves, only in how you read around them. Here’s my routine.
- Keep the harmless block in one saved script, and use it every time you read sys.dm_os_wait_stats.
- After an upgrade, check the top of the unfiltered list for new background tasks.
- Run the three tests on any unknown wait before you add it, with a why code.
- Measure a busy window, not the totals since restart (see Wait Stats Over Time).
- Once a year, reread the list and remove any name you can’t explain.
New in SQL Server 2022 and 2025
Nothing about harmless waits changed. Since SQL Server 2022, Query Store is on by default for new databases. Its QDS_ sleeping waits now show up on more servers. Run the three tests on any new name you meet on SQL Server 2025.
Related Reading
- Reading the Top Five Wait Types on Your Server
- SQL SERVER – Wait Stats Collection Scripts for 2016 and Later Versions
- SQL SERVER – Top 3 Wait Stats from Real-World
The Clipboard Diner, a wait stats series. Previous: PAGELATCH Wait Stats: Hot Pages in Memory and tempdb. Next: BACKUPIO Wait Stats: Why Backups Wait. Every post is listed in the series guide.
The night truck comes back next, and this time it waits for empty crates.
A big wait is not always a slow wait, it is sometimes a baker asleep until 4 AM.
Published by Pinal Dave on SQLAuthority. More of my work at pinaldave.com.
Discover more from SQL Authority with Pinal Dave
Subscribe to get the latest posts sent to your email.



3 Comments. Leave new
No comments here?
Need more detail on this wait type. We have an application that heavily utilizes FullText Search and this wait type has been at the top of the list for the last few days.
Had same issue… FT_IFTS_SCHEDULER_IDLE_WAIT… removed contention with tempdb and wait time solved…