
Wait stats explained in one picture: SQL Server is an all-night diner, and every query is an order ticket. A ticket that’s late isn’t lazy. It’s waiting for something, and SQL Server writes down exactly what.

This post opens my wait stats series, told as one story at the Clipboard Diner. Every post is listed in the series guide.
Night 0 at the Clipboard Diner
The Clipboard Diner sits at mile marker 28 on a two-lane highway through farm country. It never closes. It has red booths, a pie case, four burners, and a jukebox that only knows one song. Truckers love it. Everyone else loves the pie.
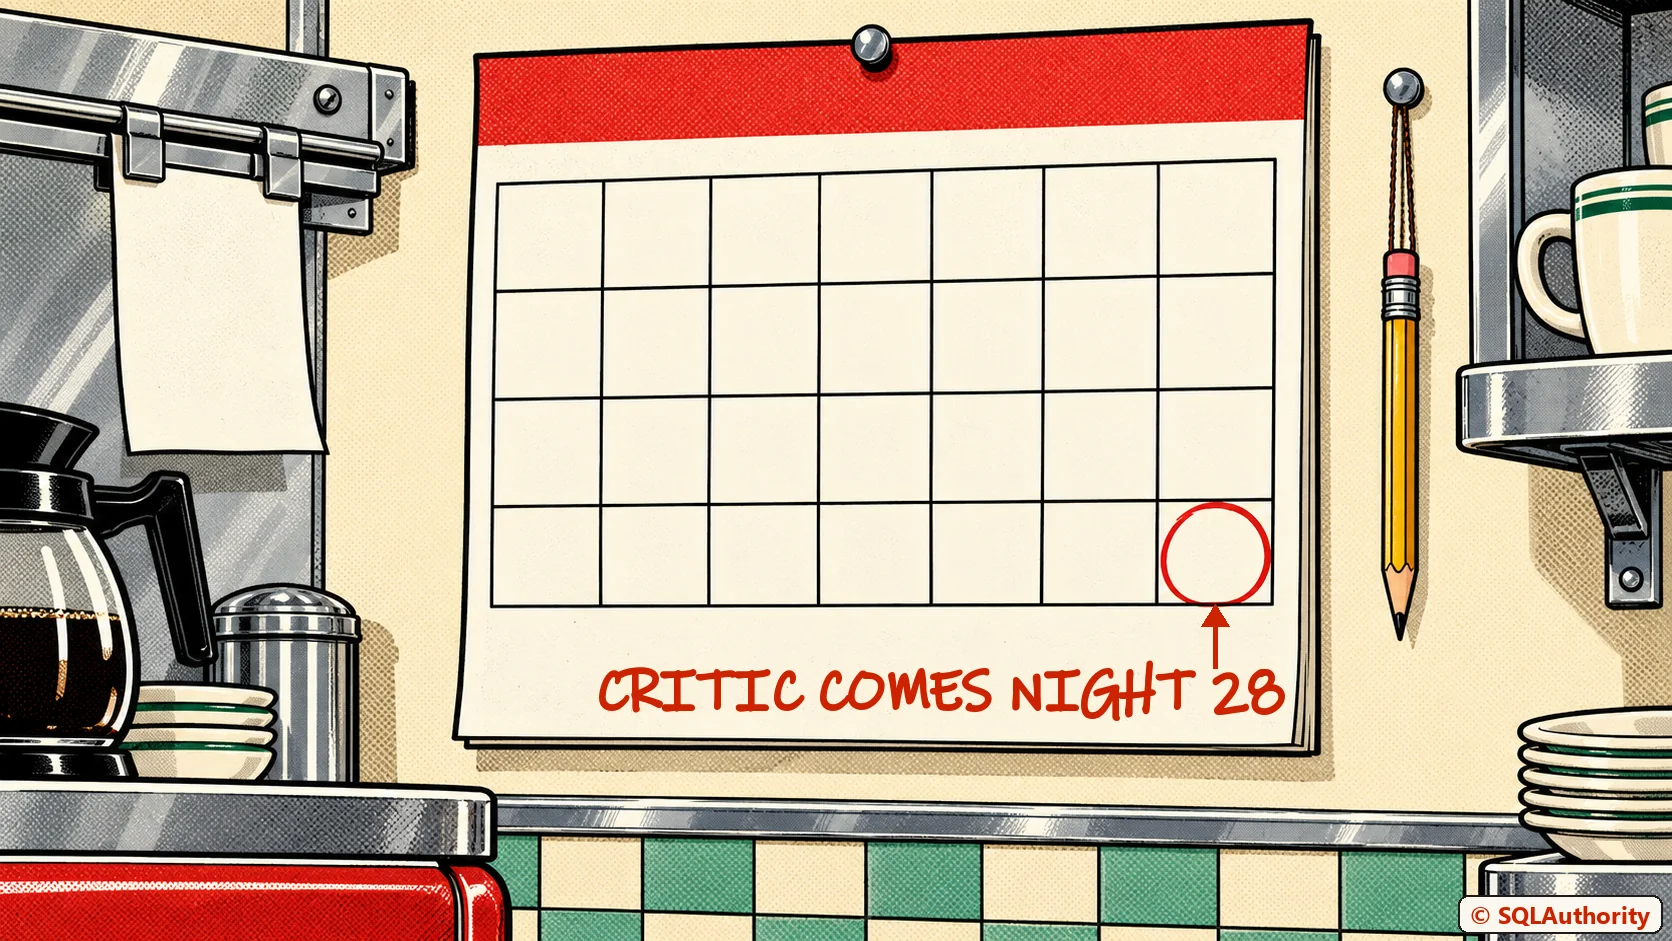
One Tuesday a postcard arrived for Casey, the owner. The food critic from the county paper would eat at the Clipboard Diner in 28 nights. No date, no hint, only one line: See you in 28 nights. Casey read it twice, pinned it above the register, and looked at the kitchen.
The food was good. It had always been good. The trouble was the time it took to reach the table. Casey used to ask the cooks, “Why are we so slow tonight?” The cooks would shrug, because nobody was slacking. Everybody was busy, and the plates were still late.
So Casey bought a clipboard and a stopwatch and changed the question. From now on it would be: What are we waiting for? Casey wrote that across the top of the clipboard and hung it by the pass. There were 28 nights to find out.
Why a Diner Explains SQL Server
A kitchen waits the same way SQL Server waits. A query is an order ticket. It needs a cook, a burner, ingredients, a booth and somebody to carry the plate. Any of those can be missing for a moment, and every missing moment is a wait.
SQL Server writes down each of those moments by name. The names are wait types, and the running totals are wait stats. I read them first in every health check I run. They’re the fastest honest answer I know to “why is this slow?”
You could argue that a picture like this hides the real engine. Fair point, so I’ll keep it honest. Every night in this series maps to one real wait type. Every post shows you the real views and the real fix. The diner only gives your memory something to hold on to.
Meet the Kitchen
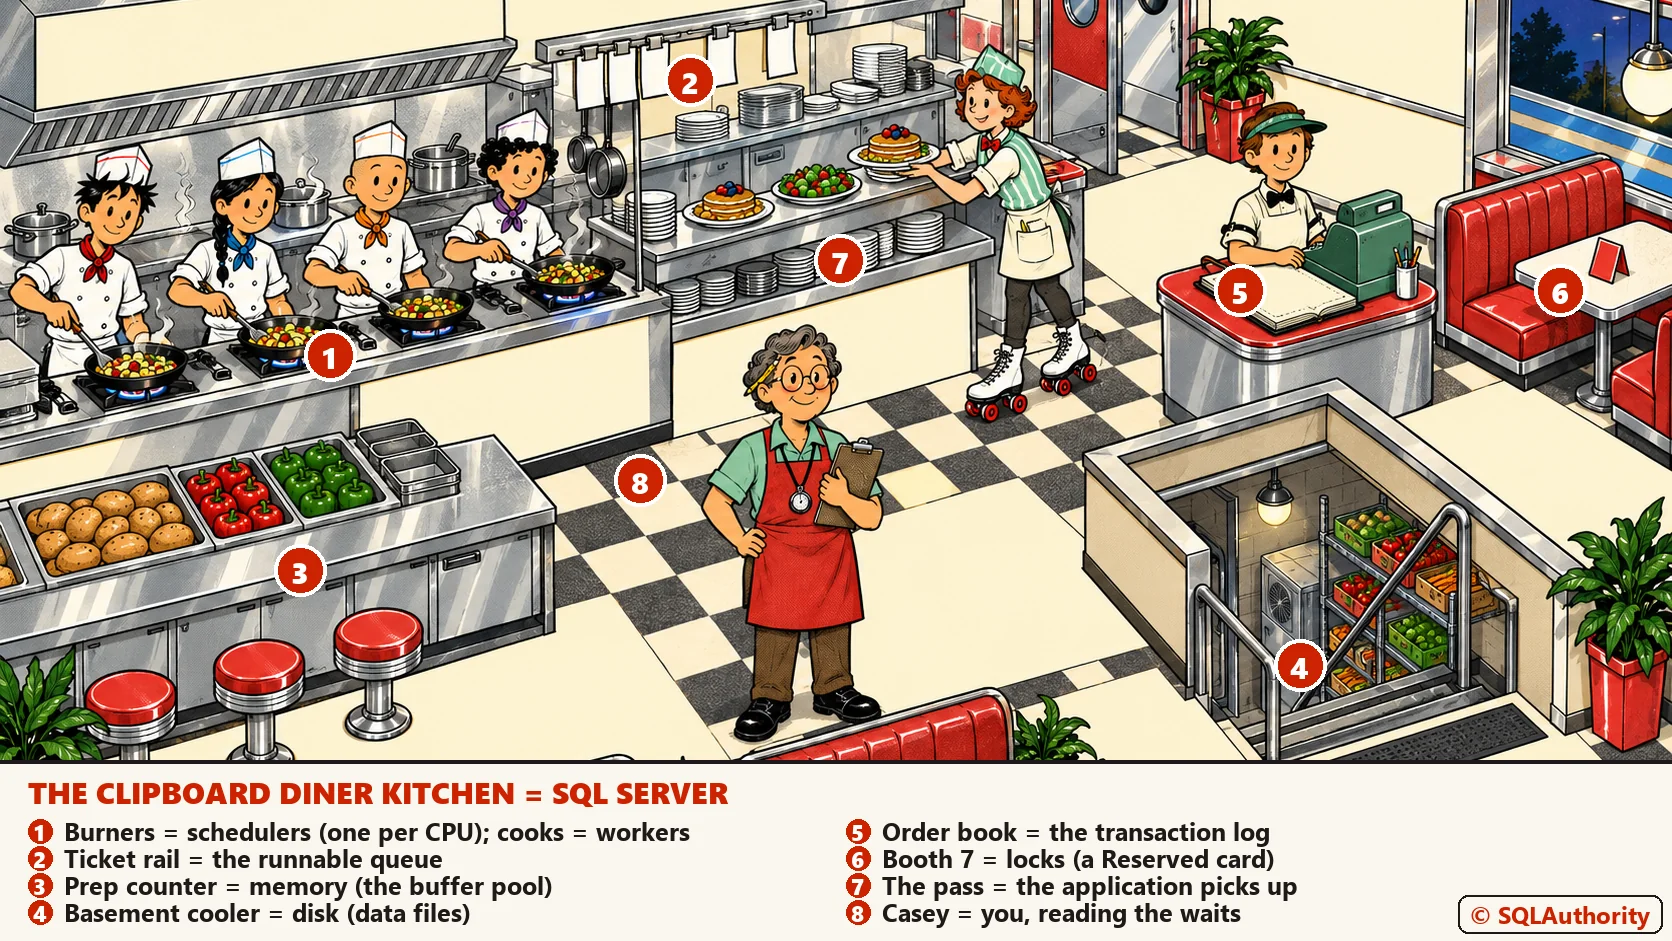
You’ll see the same people and places every night. Here’s who stands for what inside SQL Server.
- Casey is the owner with the clipboard. Casey is you, the person reading the waits.
- Ace, Kit, Jesse and Jules are the cooks. A cook is a worker thread. A ticket keeps its cook from start to finish.
- The four burners are CPU schedulers, one per logical CPU. Only one cook can cook on a burner at a time.
- The ticket rail is where ready orders wait for a free burner. That’s the runnable queue.
- The prep counter is memory, where data pages sit ready. The basement cooler is the disk.
- Pat runs the register and writes every sale in the order book. That’s the transaction log.
- Quinn carries the plates to the tables. Quinn is your application.
- Dee calls “Order up!” and puts big party orders together. That’s the parallel query coordinator.
- Booth 7 is where trouble likes to sit. A “Reserved” card on a booth is a lock.
One more thing about the kitchen. The diner has more cooks on the roster than it has burners. Most of the time, most cooks are standing around waiting for something. That’s normal, and it’s the whole subject of this series.
Count Your Burners and Cooks
Your own server has a kitchen too. This query reads it from one system view and changes nothing.
-- How big is your kitchen?
SELECT cpu_count            AS logical_cpus,
       scheduler_count      AS burners,
       max_workers_count    AS cooks_on_the_roster,
       sqlserver_start_time AS clipboard_started
FROM sys.dm_os_sys_info;
The burners column is the number of schedulers SQL Server uses. The cooks column is the most worker threads it will create. The last column matters more than it looks. Wait totals start counting at that moment, or at the last manual clear. So a server that restarted this morning has a short clipboard.
How Each Post Works
Every post in the series has the same shape, so you always know where to look. It opens with one night at the diner. Then it explains the wait in plain words, with a diagram of where it happens in a query’s life.
Next comes a small table: when the wait is normal and when it’s a problem. After that you get a query to see it on your server. Then come the fixes, in the order I’d try them. Each post ends with what’s new in SQL Server 2022 and 2025 for that wait.
What You Need
The queries that show waits read system views and change nothing. When a fix changes a setting, the post says so. Try those on a test server first. I wrote them for SQL Server 2025, and they run on SQL Server 2016 and later. When a feature needs a newer version, the post says so.
You need permission to read server performance views. On SQL Server 2022 and later that’s VIEW SERVER PERFORMANCE STATE. On older versions it’s VIEW SERVER STATE. One check is different. The instant file initialization query needs VIEW SERVER SECURITY STATE on 2022 and later. Using Azure SQL Database? Read my post on sys.dm_db_wait_stats first, because the database-level view works a little differently.
I’ll be honest about one thing. Wait stats don’t fix anything by themselves. They point at the problem, and you still have to fix it. But most slow servers I see were never pointed at the right thing in the first place.
The Clipboard Diner, a wait stats series. Next: Wait Stats Basics: How Waits Work in SQL Server. Every post is listed in the series guide.
Tomorrow night, Casey follows one plate of Garden Hash from the order to the table, with a stopwatch.
A wait list is not a report card, it is a map of where the time went.
Published by Pinal Dave on SQLAuthority. More of my work at pinaldave.com.
Discover more from SQL Authority with Pinal Dave
Subscribe to get the latest posts sent to your email.




9 Comments. Leave new
Why can’t we use print in sql server function?
A function can return a single or multivalues. It cannot be used for printing purpose. If it prints, how will you use the function in the select statement?
good articles!
The
SQL SERVER – DMV – sys.dm_os_wait_stats Explanation – Wait Type – Day 3 of 28
link is broken. It should use sqlauthority.com instead of sqlity.com domain.
Some of your links on this page redirects to “http://www.hugedomains.com/domain_profile.cfm?d=sqlity&e=com”
I think I just fixed error – would you please validate it.
Seems so, haven’t testaed all of them. I tested 3 and they worked. Thank you
Thank you Robert because of your guidance, I was able to fix this error.
great work !!