
This wait stats summary puts every wait from the series on one page: what it means and the first fix. It also holds the one lesson I’d keep from all 28 nights: know what normal looks like on your server.

This post is part of my wait stats series, told as one story at the Clipboard Diner. Every post is listed in the series guide.
Night 28 at the Clipboard Diner
The chart was still on the fridge, a little crooked, next to the postcard. It was a Tuesday. A light rain came and went, and the highway smelled of wet asphalt and coffee.
Last night’s Monday bus had gone without a hitch. Dee had split the party evenly across the four cooks, and nobody got stuck with all the blueberry pancakes. Tonight the party in booth 7 paid at 7:30 and left. Pat’s pen kept up with every sale, and Quinn carried every plate while it was still hot.
At 7:52 a stranger in a gray raincoat took the last stool at the counter. There was no notebook in sight. The stranger ordered the Garden Hash and black coffee, and Casey didn’t need to be told.
Casey clicked the stopwatch out of habit. The potato bin on the prep counter was full. The ticket sat on the rail for one minute, because the quilting circle’s twelve plates were still going out. Casey watched that minute pass and didn’t move. One minute on the rail on a Tuesday at eight was normal, and four weeks of clipboard pages said so.
The jukebox played its one song. The critic ate slowly, had a slice of cherry pie, and paid Pat in cash. Under the coffee cup was a folded napkin.
Pat handed it to Casey without a word. It held one line in blue ink: Nothing at the Clipboard Diner waits longer than it should. Casey read it twice, the way Casey had read the postcard four weeks before. Casey pinned the postcard back above the register, with the napkin beside it. Then Casey wrote one last line: Night 28. Cooking: 4. Waiting: 1. A normal Tuesday.
What 28 Nights Taught Casey
That’s what knowing your normal looks like. The critic didn’t find a kitchen with no waiting, only waits with a reason that never ran long. A busy SQL Server waits all day too. The trouble is a wait that grows past the usual size you know.
Every Wait on One Page
| Night | Wait | What it means | First fix |
|---|---|---|---|
| 0 | Wait Stats Explained | The postcard, the cast and the kitchen map. | Start the story here. |
| 1 | Wait Stats Basics | A query is running, waiting for CPU, or waiting for a resource. | Read wait time, not wait counts. |
| 2 | Signal Wait Stats | Time in line for a CPU after the resource is ready. | Find the top CPU queries. |
| 3 | sys.dm_os_wait_stats | Totals for every wait since the last restart. | Filter out the sleepers. |
| 4 | Live Wait Stats | What each request waits on right now. | Find the head blocker. |
| 5 | Wait Stats Over Time | The waits of one busy window. | Take two snapshots and subtract. |
| 6 | CXPACKET Wait Stats | Parallel threads waiting for each other. | Fix the big scan and the skew. |
| 7 | Parallelism Wait Stats | The settings that shape parallel plans. | Set MAXDOP and cost threshold. |
| 8 | SOS_SCHEDULER_YIELD Wait Stats | A task gave up the CPU after its 4 ms turn. | Tune the top CPU queries. |
| 9 | PAGEIOLATCH Wait Stats | Waiting for a data page to come from disk. | Fewer reads first, then faster storage. |
| 10 | IO_COMPLETION Wait Stats | Non-data I/O, such as spills to tempdb. | Fix the estimates behind the spill. |
| 11 | ASYNC_IO_COMPLETION Wait Stats | Large file work: backups, restores, file growth. | Growth: instant file initialization. Backups: read and write speed. |
| 12 | PAGELATCH Wait Stats | A hot page in memory, such as a last page or tempdb. | Sequential key option, more tempdb files. |
| 13 | Harmless Wait Stats | Background tasks resting on purpose. | Filter them. Never chase them. |
| 14 | BACKUPIO Wait Stats | A backup waits on reads or on its target. | Faster target, striping, compression. |
| 15 | LCK_M Wait Stats | Waiting for a lock another session holds. | Shorten the head blocker’s transaction. |
| 16 | THREADPOOL Wait Stats | No worker thread is free for a new task. | Fix the blocking that holds the workers. |
| 17 | WRITELOG Wait Stats | Waiting for the log to reach disk at commit. | Fewer tiny commits, then fast log storage. |
| 18 | LOGBUFFER Wait Stats | Waiting for room in the log buffer. | The same fixes as WRITELOG. |
| 19 | PREEMPTIVE Wait Stats | A call out to Windows. | Find the exact wait and its feature. |
| 20 | MSQL_XP Wait Stats | An extended procedure is running. | Move the work outside SQL Server. |
| 21 | ASYNC_NETWORK_IO Wait Stats | The application isn’t reading the results. | Fix how the application reads. |
| 22 | HADR_SYNC_COMMIT Wait Stats | Waiting for a synchronous replica to confirm the commit. | Check the secondary’s log disk and the network. |
| 23 | OLEDB Wait Stats | Waiting on a linked server. | Filter remotely, or copy the data locally. |
| 24 | Optimized Locking Wait Stats | Waiting on another transaction’s ID. | Shorten long transactions. |
| 25 | RESOURCE_SEMAPHORE Wait Stats | Waiting for a memory grant before starting. | Fix oversized grants. |
| 26 | Batch Mode Wait Stats | Threads waiting for a shared hash table or sort. | Leave it, or fix skew and spills. |
| 27 | Wait Stats Troubleshooting | The one-page chart for any top wait. | One question, then one fix. |
| 28 | Wait Stats Summary (this page) | Your normal. | Keep a baseline. |
Know Your Normal
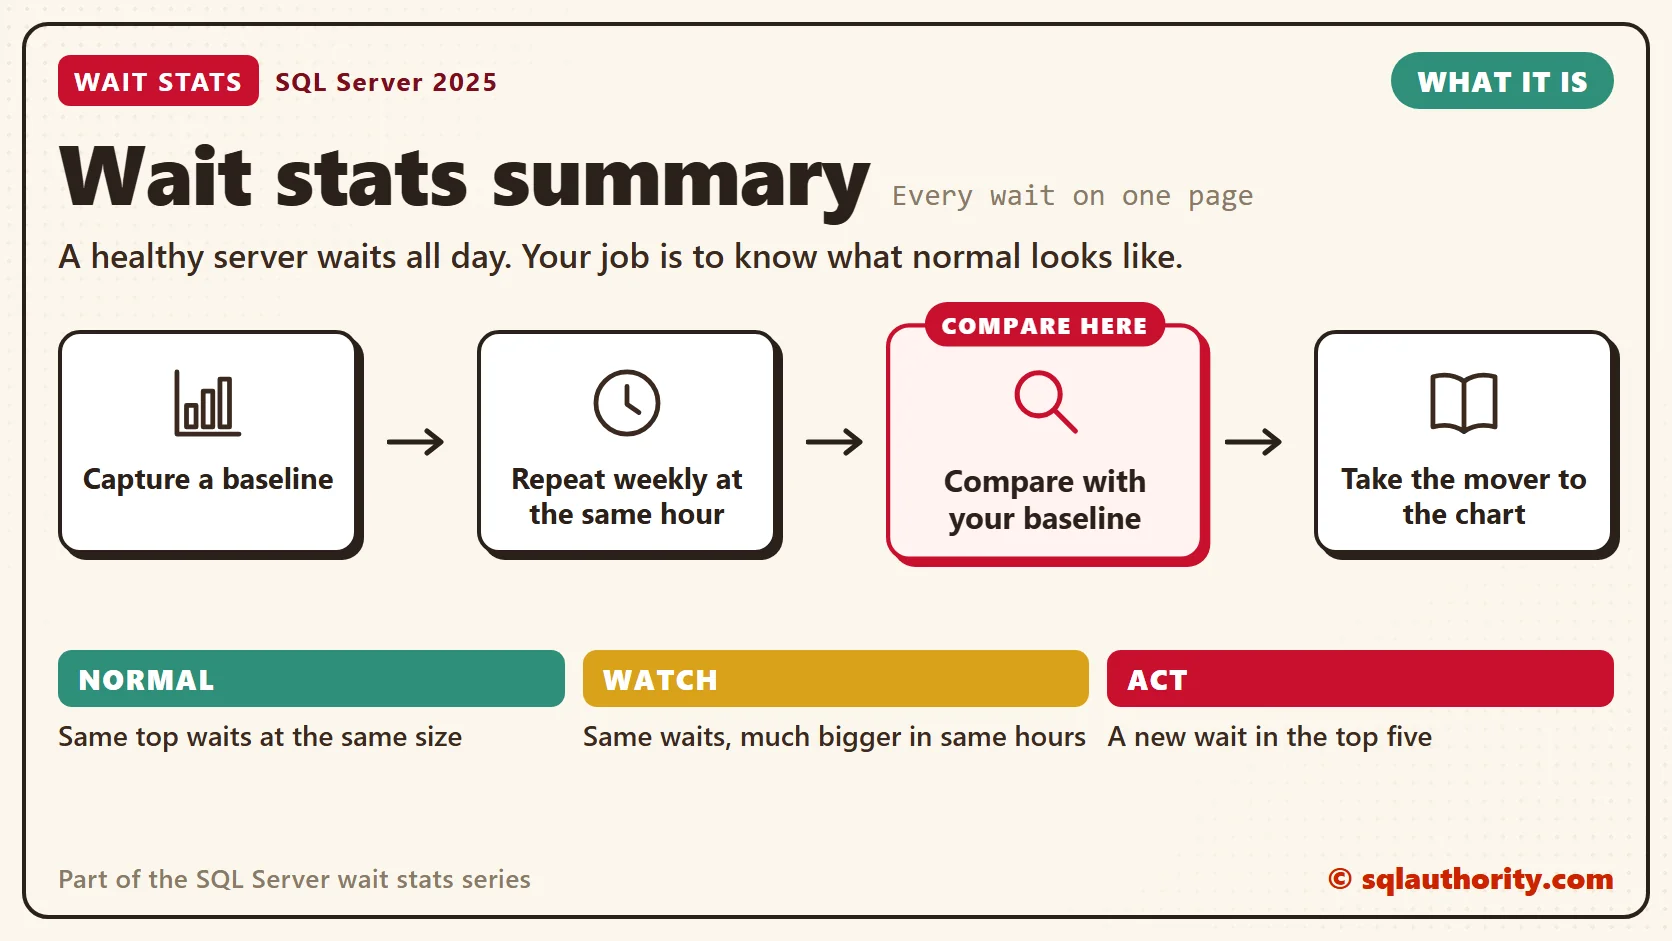
In my health checks, I start with last month’s top wait, not today’s. A server with CXPACKET on top every week for two years is telling you about its workload. That’s the diner’s jukebox, playing the same song every night. A server where WRITELOG jumped to the top on Monday is telling you something changed.
Normal or a Problem?
| Situation | What it means | What to do |
|---|---|---|
| The same top waits, at the same size as your baseline | Your normal. | Nothing. Write it down again next week. |
| The same waits, much bigger during the same hours | More load, or something got slower. | Compare the busiest queries with last week. |
| A new wait enters the top five | Something changed: a release, a setting, or data growth. | Read that wait’s post in the series. |
See It on Your Server
This query gives a rough first view of normal: seconds per hour of uptime for each real wait, dated. It skips the 87 harmless waits from Harmless Wait Stats.
-- The harmless list: background housekeeping and deliberate pauses, not user work.
-- why: sleep = sleeps until needed, idle = waits for background work, startup = only at startup,
-- waitfor = asked to wait, broker/ag/trace/qstore/fulltext/xtp/clr = feature housekeeping,
-- internal = internal background task.
DECLARE @harmless TABLE (wait_type nvarchar(60) PRIMARY KEY, why varchar(10) NOT NULL);
INSERT @harmless (wait_type, why) VALUES
    (N'LAZYWRITER_SLEEP', 'sleep'), (N'SLEEP_BPOOL_FLUSH', 'sleep'), (N'SLEEP_TASK', 'sleep'),
    (N'SP_SERVER_DIAGNOSTICS_SLEEP', 'sleep'), (N'CHECKPOINT_QUEUE', 'idle'),
    (N'DIRTY_PAGE_POLL', 'idle'), (N'DISPATCHER_QUEUE_SEMAPHORE', 'idle'),
    (N'KSOURCE_WAKEUP', 'idle'), (N'LOGMGR_QUEUE', 'idle'), (N'ONDEMAND_TASK_QUEUE', 'idle'),
    (N'PREEMPTIVE_SP_SERVER_DIAGNOSTICS', 'idle'), (N'REQUEST_FOR_DEADLOCK_SEARCH', 'idle'),
    (N'RESOURCE_QUEUE', 'idle'), (N'SERVER_IDLE_CHECK', 'idle'), (N'SNI_HTTP_ACCEPT', 'idle'),
    (N'SOS_WORK_DISPATCHER', 'idle'), (N'UCS_SESSION_REGISTRATION', 'idle'),
    (N'VDI_CLIENT_OTHER', 'idle'), (N'CHKPT', 'startup'),
    (N'PWAIT_ALL_COMPONENTS_INITIALIZED', 'startup'), (N'SLEEP_DBSTARTUP', 'startup'),
    (N'SLEEP_DCOMSTARTUP', 'startup'), (N'SLEEP_MASTERDBREADY', 'startup'),
    (N'SLEEP_MASTERMDREADY', 'startup'), (N'SLEEP_MASTERUPGRADED', 'startup'),
    (N'SLEEP_MSDBSTARTUP', 'startup'), (N'SLEEP_PHYSMASTERDBREADY', 'startup'),
    (N'SLEEP_SYSTEMTASK', 'startup'), (N'SLEEP_TEMPDBSTARTUP', 'startup'),
    (N'STARTUP_DEPENDENCY_MANAGER', 'startup'), (N'WAITFOR', 'waitfor'),
    (N'WAITFOR_TASKSHUTDOWN', 'waitfor'), (N'WAIT_FOR_RESULTS', 'waitfor'),
    (N'BROKER_EVENTHANDLER', 'broker'), (N'BROKER_TASK_STOP', 'broker'),
    (N'BROKER_TO_FLUSH', 'broker'), (N'BROKER_TRANSMITTER', 'broker'), (N'DBMIRRORING_CMD', 'ag'),
    (N'DBMIRROR_DBM_EVENT', 'ag'), (N'DBMIRROR_DBM_MUTEX', 'ag'), (N'DBMIRROR_EVENTS_QUEUE', 'ag'),
    (N'DBMIRROR_WORKER_QUEUE', 'ag'), (N'HADR_CLUSAPI_CALL', 'ag'),
    (N'HADR_FILESTREAM_IOMGR_IOCOMPLETION', 'ag'), (N'HADR_LOGCAPTURE_WAIT', 'ag'),
    (N'HADR_NOTIFICATION_DEQUEUE', 'ag'), (N'HADR_TIMER_TASK', 'ag'), (N'HADR_WORK_QUEUE', 'ag'),
    (N'PARALLEL_REDO_DRAIN_WORKER', 'ag'), (N'PARALLEL_REDO_LOG_CACHE', 'ag'),
    (N'PARALLEL_REDO_TRAN_LIST', 'ag'), (N'PARALLEL_REDO_WORKER_SYNC', 'ag'),
    (N'PARALLEL_REDO_WORKER_WAIT_WORK', 'ag'), (N'PREEMPTIVE_HADR_LEASE_MECHANISM', 'ag'),
    (N'REDO_THREAD_PENDING_WORK', 'ag'), (N'PREEMPTIVE_XE_CALLBACKEXECUTE', 'trace'),
    (N'PREEMPTIVE_XE_DISPATCHER', 'trace'), (N'PREEMPTIVE_XE_GETTARGETSTATE', 'trace'),
    (N'PREEMPTIVE_XE_SESSIONCOMMIT', 'trace'), (N'PREEMPTIVE_XE_TARGETFINALIZE', 'trace'),
    (N'PREEMPTIVE_XE_TARGETINIT', 'trace'), (N'SQLTRACE_BUFFER_FLUSH', 'trace'),
    (N'SQLTRACE_INCREMENTAL_FLUSH_SLEEP', 'trace'), (N'SQLTRACE_WAIT_ENTRIES', 'trace'),
    (N'XE_BUFFERMGR_ALLPROCESSED_EVENT', 'trace'), (N'XE_DISPATCHER_JOIN', 'trace'),
    (N'XE_DISPATCHER_WAIT', 'trace'), (N'XE_LIVE_TARGET_TVF', 'trace'),
    (N'XE_TIMER_EVENT', 'trace'), (N'QDS_ASYNC_QUEUE', 'qstore'),
    (N'QDS_CLEANUP_STALE_QUERIES_TASK_MAIN_LOOP_SLEEP', 'qstore'),
    (N'QDS_PERSIST_TASK_MAIN_LOOP_SLEEP', 'qstore'), (N'QDS_SHUTDOWN_QUEUE', 'qstore'),
    (N'FT_IFTSHC_MUTEX', 'fulltext'), (N'FT_IFTSISM_MUTEX', 'fulltext'),
    (N'FT_IFTS_SCHEDULER_IDLE_WAIT', 'fulltext'), (N'WAIT_XTP_CKPT_CLOSE', 'xtp'),
    (N'WAIT_XTP_HOST_WAIT', 'xtp'), (N'WAIT_XTP_OFFLINE_CKPT_NEW_LOG', 'xtp'),
    (N'WAIT_XTP_RECOVERY', 'xtp'), (N'CLR_AUTO_EVENT', 'clr'),
    (N'AZURE_IMDS_VERSIONS', 'internal'), (N'POPULATE_LOCK_ORDINALS', 'internal'),
    (N'PVS_PREALLOCATE', 'internal'), (N'PWAIT_DIRECTLOGCONSUMER_GETNEXT', 'internal'),
    (N'PWAIT_EXTENSIBILITY_CLEANUP_TASK', 'internal'), (N'SOS_WORKER_MIGRATION', 'internal');

-- Your normal in one dated snapshot: real waits per hour of uptime.
-- Run it in the same batch as the list above, and keep every week's copy.
SELECT TOP (10)
       CAST(SYSDATETIME() AS date) AS captured_on,
       up.started_at,
       w.wait_type,
       CAST(w.wait_time_ms / 1000.0 / up.hours_up AS decimal(18,1)) AS sec_per_hour,
       CAST(1.0 * w.wait_time_ms / NULLIF(w.waiting_tasks_count, 0) AS decimal(18,1)) AS avg_wait_ms,
       CAST(100.0 * w.signal_wait_time_ms / NULLIF(w.wait_time_ms, 0) AS decimal(5,1)) AS signal_pct,
       CAST(up.hours_up AS decimal(18,1)) AS hours_up
FROM sys.dm_os_wait_stats AS w
CROSS APPLY (SELECT i.sqlserver_start_time AS started_at,
                    NULLIF(DATEDIFF(MINUTE, i.sqlserver_start_time, SYSDATETIME()) / 60.0, 0) AS hours_up
             FROM sys.dm_os_sys_info AS i) AS up
WHERE w.waiting_tasks_count > 0
  AND NOT EXISTS (SELECT 1 FROM @harmless AS h WHERE h.wait_type = w.wait_type COLLATE DATABASE_DEFAULT)
ORDER BY w.wait_time_ms DESC;
A wait whose sec_per_hour jumped since last week’s copy comes first. The shortcut assumes nobody cleared the wait stats since started_at, because a clear makes sec_per_hour read too low. After a clear, or for more detail, measure one busy hour with two snapshots, as Wait Stats Over Time shows.
Fix It
You could say a monitoring tool already keeps a baseline. Fair point, but plenty of shops have the tool and have never looked at a normal week.
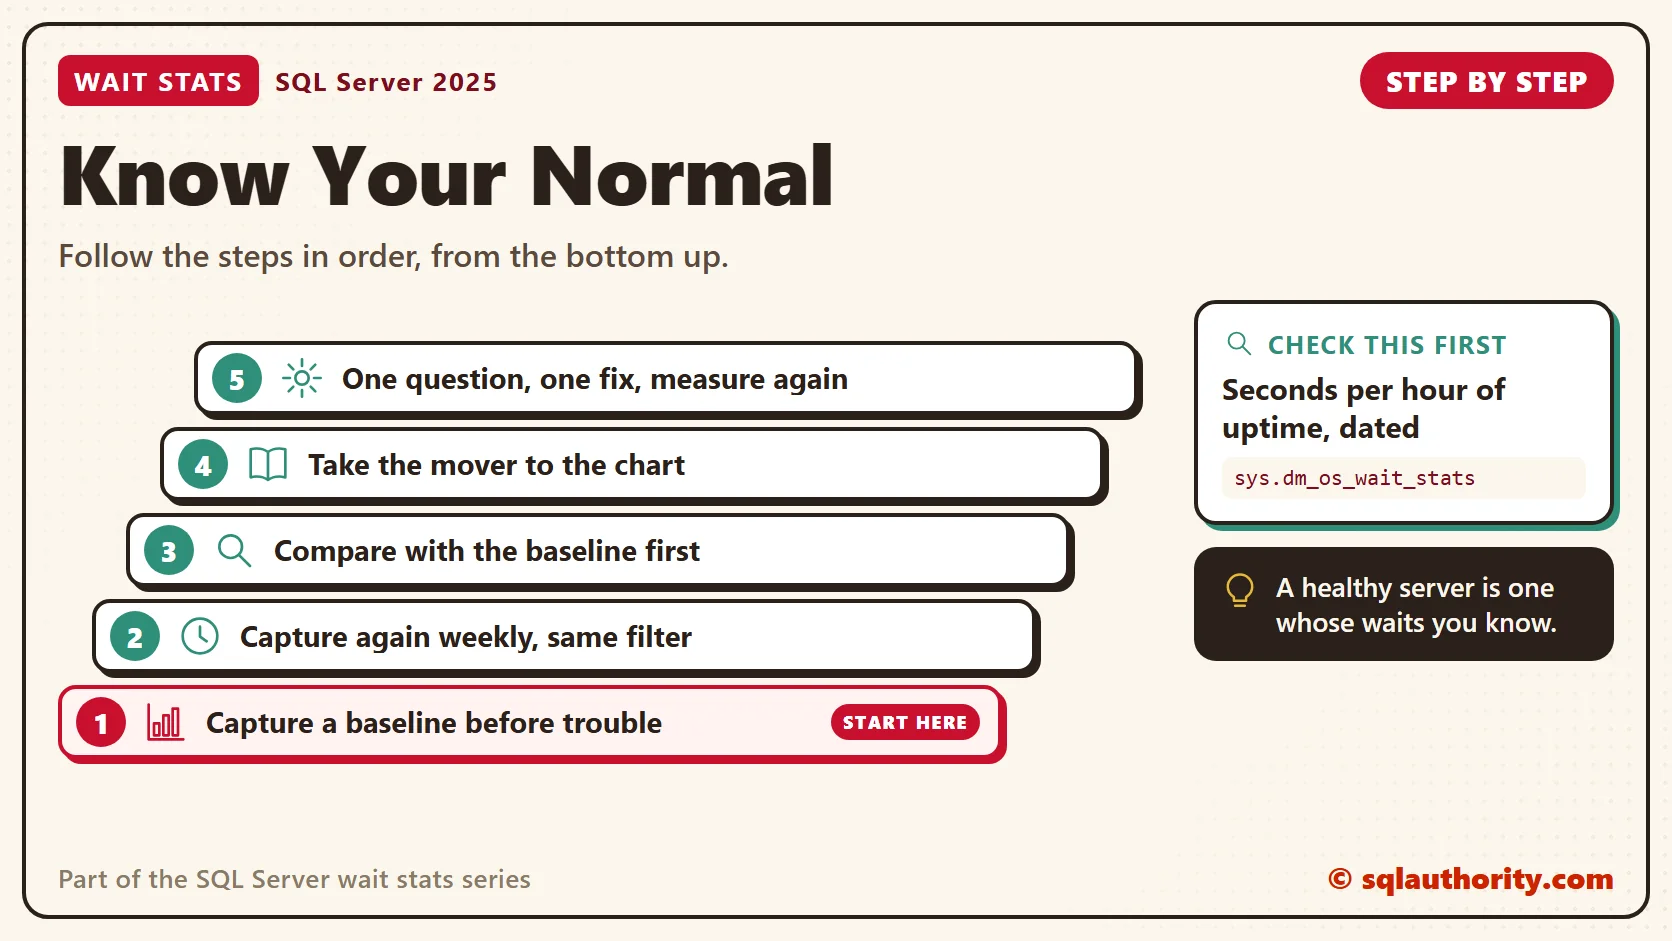
- Capture a baseline today, before anything is wrong (see capture a wait stats baseline before changing anything).
- Capture it again every week, at the same busy hour, with the same filter.
- When users complain, compare against the baseline before you change anything.
- Take the wait that moved to the Wait Stats Troubleshooting chart: one question, one fix, then measure again.
New in SQL Server 2022 and 2025
SQL Server 2025 brought optimized locking and its XACT waits, DOP feedback on by default, and ZSTD backup compression. It also added Resource Governor tempdb space limits and optimized sp_executesql.
SQL Server 2022 brought faster log growth, less tempdb latch contention and Query Store on by default. It also improved memory grant feedback, and both feedback features are Enterprise only. None of it changes the question you ask.
The Last Page
At 4 AM the night baker woke up, right on time, and the smell of bread filled the diner. Out front, the neon sign still flickered on one letter. Casey had meant to fix it for four weeks, and finally decided it was part of the place. Some waits are like that. You learn their size, you write them down, and you leave them alone.
Casey turned the clipboard to a clean page. The critic was gone, but Wednesday was coming, and Wednesday has its own normal. Thank you for spending these nights at the diner with me. When the next slow morning comes, ask the question Casey learned to ask: what are we waiting for?
Related Reading
The Clipboard Diner, a wait stats series. Previous: Wait Stats Troubleshooting: From Top Wait to First Fix. This is the last night of the story, and the series is complete. Every post is listed in the series guide.
The Clipboard Diner is still open at mile marker 28, and the coffee’s on.
A healthy server is not one with no waits, it is one whose waits you know by heart.
Published by Pinal Dave on SQLAuthority. More of my work at pinaldave.com.
Discover more from SQL Authority with Pinal Dave
Subscribe to get the latest posts sent to your email.




3 Comments. Leave new
Love to see tuning and performance, tsql, designing database in details for month. Enjoyed wait type month.
Thank you
Hi sir
its really help full tips
I love your session always thats y I always atttain TechDays of ahmedabad every year….
Thanks a lot…. this article help me to understood many things…… Sds….