Signal waits show how long tasks queue for a CPU after everything else they needed is ready. The share of signal waits in all waits is a quick first check for CPU pressure. The first reading of it misleads.

What a Signal Wait Is
A task that has to wait for a lock or a disk read steps off the CPU. When the thing it waited for is ready, the task doesn’t run at once. It joins a queue and waits for a free CPU. That last stretch is the signal wait.
SQL Server records both parts. The column wait_time_ms holds the whole wait, and signal_wait_time_ms holds the queue part. The difference is the resource wait. The counters start at zero when the instance starts, so every reading is a total since then.
Which Wait Types Carry the Signal Time
Before you read a share, look at who owns the numbers. This query sorts the wait types by signal time and shows how much of each wait was signal time. It also shows each type’s part of all signal time on the server.
SELECT TOP (8) w.wait_type, w.waiting_tasks_count AS Waits, w.wait_time_ms AS WaitMs, w.signal_wait_time_ms AS SignalMs,
       CAST(100.0 * w.signal_wait_time_ms / NULLIF(w.wait_time_ms, 0) AS decimal(5,1)) AS SignalPercentOfWait,
       CAST(100.0 * w.signal_wait_time_ms / NULLIF(SUM(w.signal_wait_time_ms) OVER (), 0) AS decimal(5,1)) AS ShareOfAllSignal
FROM sys.dm_os_wait_stats AS w
WHERE w.signal_wait_time_ms > 0
ORDER BY w.signal_wait_time_ms DESC;| wait_type | Waits | WaitMs | SignalMs | SignalPercentOfWait | ShareOfAllSignal |
|---|---|---|---|---|---|
| REQUEST_FOR_DEADLOCK_SEARCH | 285 | 1422009 | 1422009 | 100.0 | 26.8 |
| XE_TIMER_EVENT | 368 | 1421978 | 1421790 | 100.0 | 26.8 |
| PWAIT_EXTENSIBILITY_CLEANUP_TASK | 6 | 1260044 | 1260044 | 100.0 | 23.7 |
| SP_SERVER_DIAGNOSTICS_SLEEP | 5 | 1200023 | 1200023 | 100.0 | 22.6 |
| LOGMGR_QUEUE | 178954 | 5698372 | 3811 | 0.1 | 0.1 |
| SOS_WORK_DISPATCHER | 12209 | 97906883 | 3201 | 0.0 | 0.1 |
| WRITELOG | 70029 | 9120 | 1650 | 18.1 | 0.0 |
| SLEEP_TASK | 10144 | 4862708 | 671 | 0.0 | 0.0 |
The top four types are timers and sleeps. Each has a signal time equal to its wait time, so its percent is 100. A timer isn’t a task queuing for a CPU. The wait ends when the timer fires, and SQL Server counts the whole stretch as signal time. Together the four hold 99.9 percent of all signal time in this run.
Below them, WRITELOG shows a real mix, with 18.1 percent of its wait as signal time. SOS_WORK_DISPATCHER shows the opposite problem. It has 97,906,883 ms of idle waiting and almost no signal time. Timers push the total share up, and idle waits pull it down. Which one wins changes from run to run, so the total share since the restart can’t be trusted. The values here are one run.
Sample a Working Day Into a Small Table
A total since the restart can’t show the hour when users complained. Store a sample on a schedule instead, and subtract each sample from the next one. The next script creates a demo database named SignalSampleDemo with one small table. It also creates a procedure that stores the totals of the waits that matter. The procedure leaves out the timers and sleeps found above.
IF DB_ID(N'SignalSampleDemo') IS NULL CREATE DATABASE SignalSampleDemo;
GO
USE SignalSampleDemo;
GO
DROP TABLE IF EXISTS dbo.SignalSample;
CREATE TABLE dbo.SignalSample (SampleID int IDENTITY(1,1) PRIMARY KEY, SampledAt datetime2(0) NOT NULL DEFAULT SYSDATETIME(), WaitMs bigint NOT NULL, SignalMs bigint NOT NULL);
GO
CREATE OR ALTER PROCEDURE dbo.TakeSignalSample AS
    INSERT INTO dbo.SignalSample (WaitMs, SignalMs)
    SELECT SUM(wait_time_ms), SUM(signal_wait_time_ms)
    FROM sys.dm_os_wait_stats
    WHERE wait_type NOT IN (N'REQUEST_FOR_DEADLOCK_SEARCH', N'XE_TIMER_EVENT', N'XE_DISPATCHER_WAIT', N'WAITFOR', N'SOS_WORK_DISPATCHER', N'PWAIT_EXTENSIBILITY_CLEANUP_TASK', N'DIRTY_PAGE_POLL', N'CLR_AUTO_EVENT')
      AND wait_type NOT LIKE N'%QUEUE%' AND wait_type NOT LIKE N'%SLEEP%';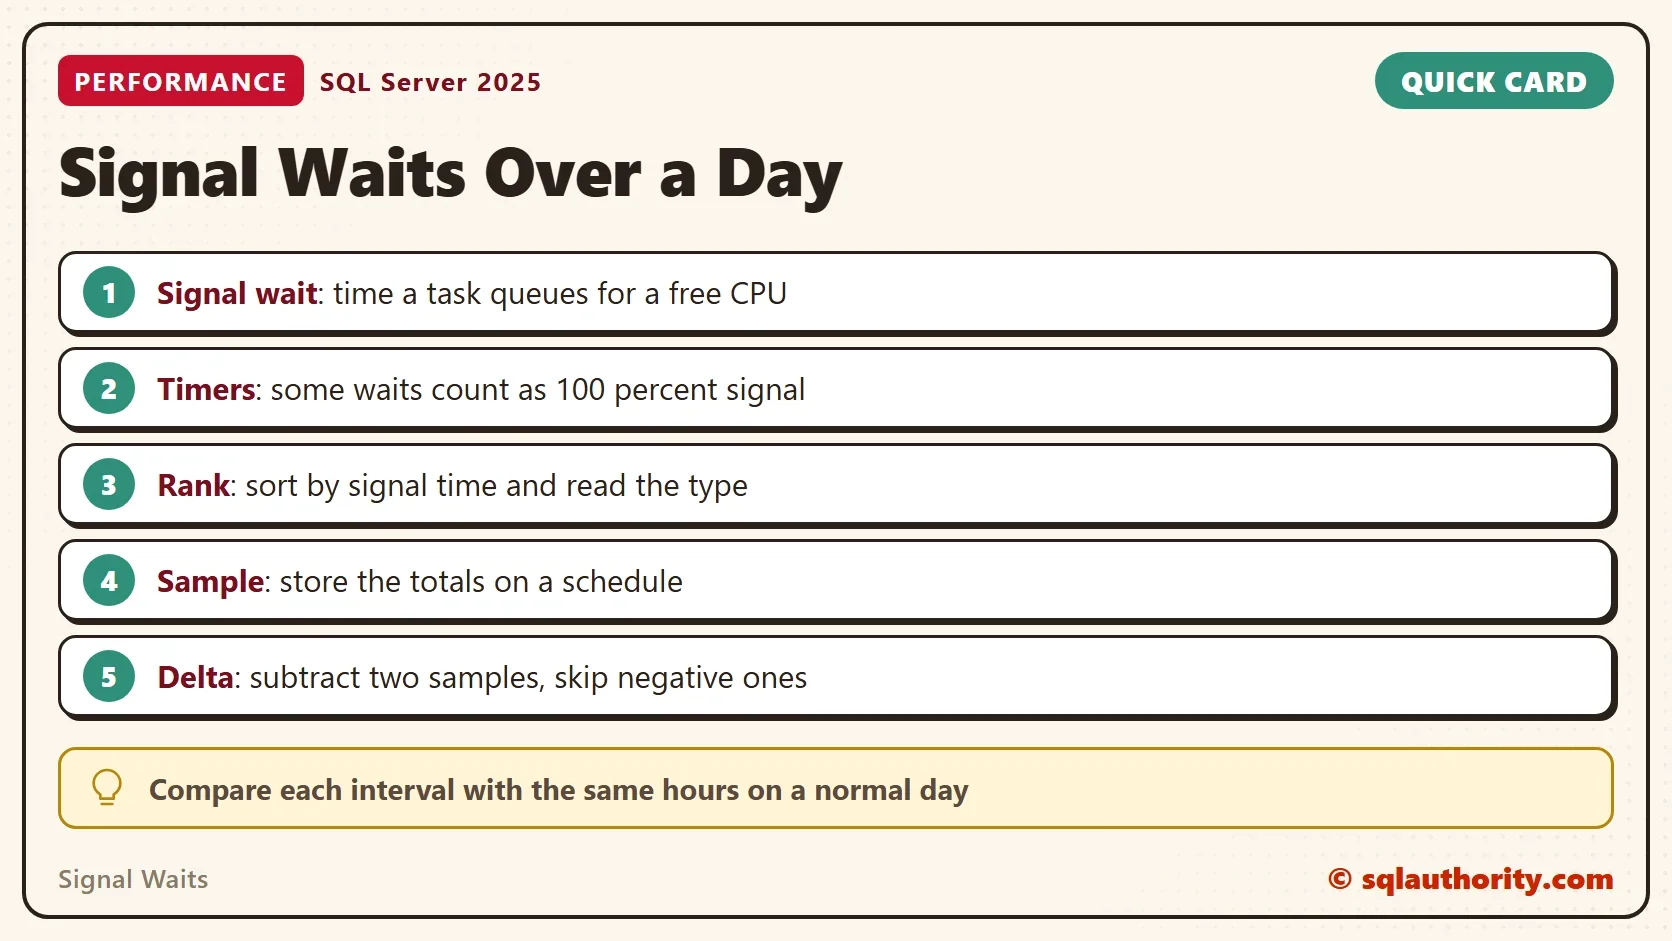
In real use, a SQL Server Agent job calls the procedure every 15 minutes. That gives 96 rows a day. The demo takes four samples, three seconds apart, in a loop that stops after four passes.
DECLARE @i int = 1;
WHILE @i <= 4
BEGIN
    EXEC dbo.TakeSignalSample;
    IF @i < 4 WAITFOR DELAY '00:00:03';
    SET @i += 1;
END;
The report subtracts each sample from the one before it with LAG. It skips any pair with a negative delta. A restart resets the counters, so the next sample is lower than the last.
WITH Pairs AS (
    SELECT SampleID, SampledAt,
           WaitMs - LAG(WaitMs) OVER (ORDER BY SampleID) AS WaitDelta,
           SignalMs - LAG(SignalMs) OVER (ORDER BY SampleID) AS SignalDelta
    FROM dbo.SignalSample
)
SELECT SampledAt, WaitDelta, SignalDelta, CAST(100.0 * SignalDelta / NULLIF(WaitDelta, 0) AS decimal(5,1)) AS SignalPercent
FROM Pairs
WHERE WaitDelta >= 0 AND SignalDelta >= 0
ORDER BY SampleID;| SampledAt | WaitDelta | SignalDelta | SignalPercent |
|---|---|---|---|
| 2026-10-07 07:04:55 | 14043 | 11 | 0.1 |
| 2026-10-07 07:04:58 | 4435 | 31 | 0.7 |
| 2026-10-07 07:05:01 | 10222 | 4 | 0.0 |
The test server was not CPU bound. The three intervals show 0.1, 0.7 and 0.0 percent on a few thousand milliseconds of waiting. That is the shape of a healthy interval. A queue shows a signal share that climbs while the wait delta grows. In real use the report covers a whole day, and you sort it by SignalDelta to find the worst interval. Your times and values will differ.
Read the Samples
Read the signal milliseconds next to the percent. A high share on a few hundred milliseconds of waiting is noise. A high share on minutes of waiting in one interval is a real queue. Compare the busy hours with the same hours on a normal day, because every server has its own baseline.
One slow server showed a signal share near 75 percent. The CPU bottleneck behind it took a two hour session to find and remove. A sample table shows such an interval the moment it happens. The post Measure CPU Pressure in SQL Server with Waits and Schedulers covers the scheduler queue and the CPU caps.
You could argue that signal waits are a blunt tool. They say that tasks queue, not which query made them queue. That’s true. They also can’t tell a busy server from an undersized one. They do show when to look, and that saves a search through a whole day of data.
What to Remember
Don’t trust the total share of signal waits, because timer waits count as 100 percent signal. Sort by signal time to see who owns the numbers, and leave the timers out of your own sample. Store totals on a schedule and subtract.
Skip negative deltas after a restart, and read the milliseconds beside the percent. When you finish with the demo, drop the demo database.
USE master;
GO
IF DB_ID(N'SignalSampleDemo') IS NOT NULL
BEGIN
    ALTER DATABASE SignalSampleDemo SET SINGLE_USER WITH ROLLBACK IMMEDIATE;
    DROP DATABASE SignalSampleDemo;
END;
Signal waits are not a diagnosis, they are a question about the CPU.
Published by Pinal Dave on SQLAuthority. More of my work at pinaldave.com.
Discover more from SQL Authority with Pinal Dave
Subscribe to get the latest posts sent to your email.