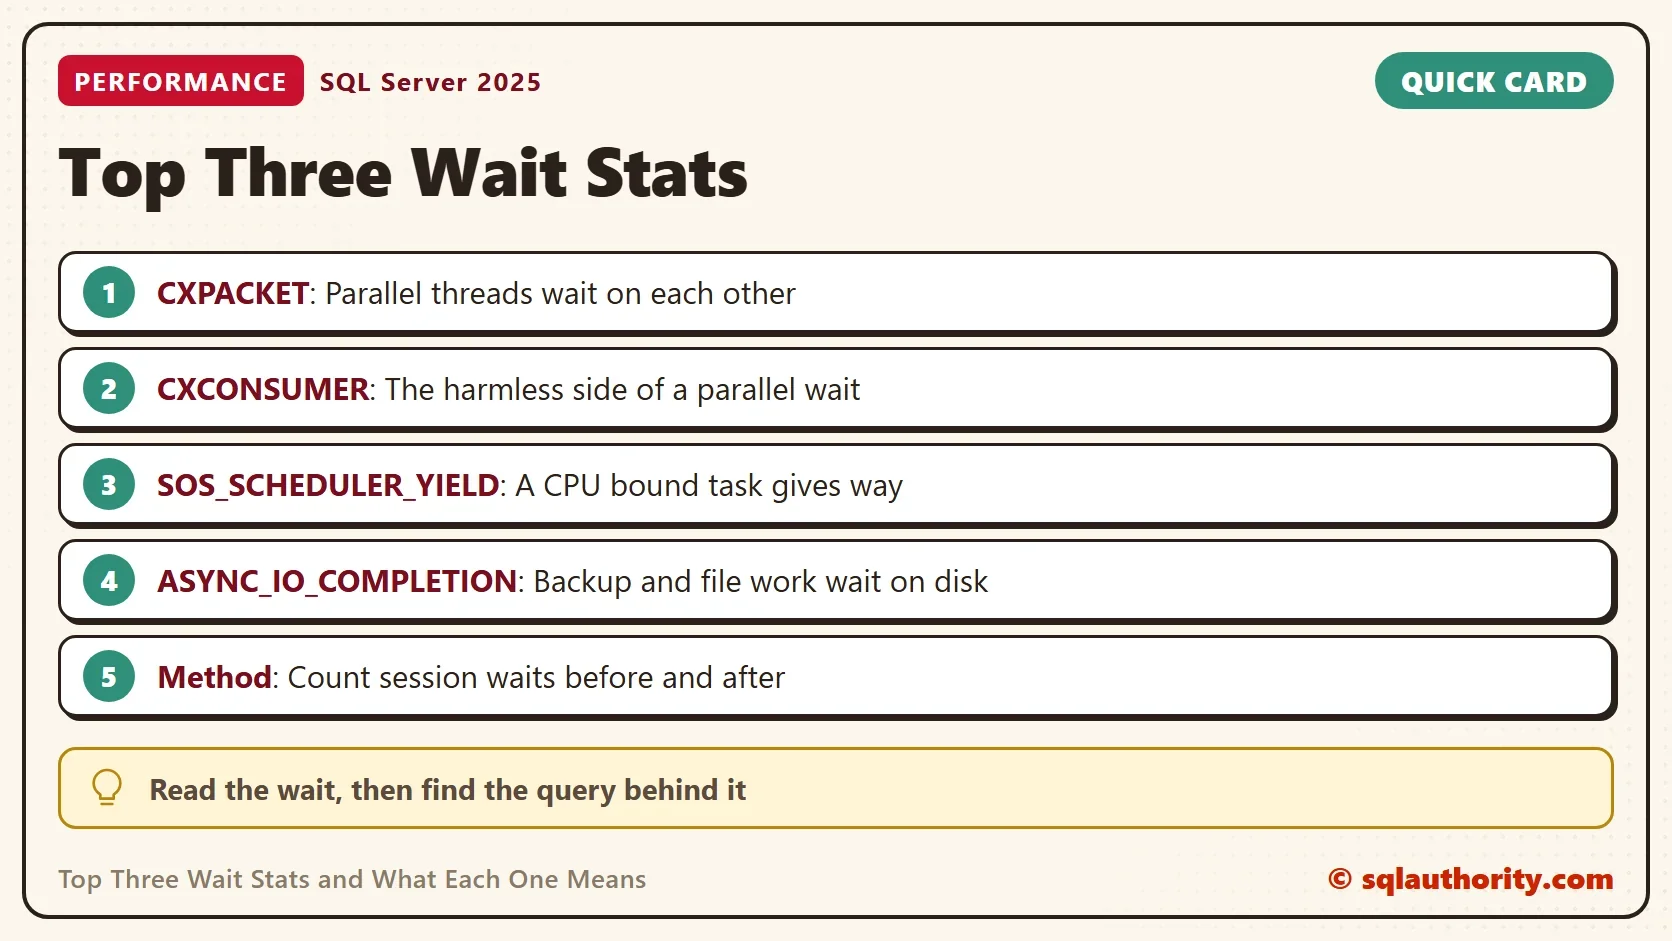
The top three wait stats in the files that people sent me were CXPACKET, SOS_SCHEDULER_YIELD and ASYNC_IO_COMPLETION. Each one points at a different part of the server. A small demo makes every wait happen on purpose, so you can see what it looks like.

Make a Wait Happen and Measure It
To study the top three wait stats, use a view that counts waits per session. The view sys.dm_exec_session_wait_stats counts the waits of one session, from the moment it connected. To measure one statement, read the counters before and after and subtract. The procedure below does that for any batch you hand it. It prints only the four waits covered here.
The post Session Wait Stats: Find the Query Behind a Wait Type shows the same idea on a live server. The demo creates a database named WaitSamplesDemo with one million rows. Run it on a test server. The counters also include small waits of the procedure itself. Ignore rows with a handful of tasks and no wait time.
IF DB_ID(N'WaitSamplesDemo') IS NULL CREATE DATABASE WaitSamplesDemo;
GO
USE WaitSamplesDemo;
GO
DROP TABLE IF EXISTS dbo.Readings;
CREATE TABLE dbo.Readings (ReadingID int NOT NULL CONSTRAINT PK_Readings PRIMARY KEY, Station int NOT NULL, Value int NOT NULL);
INSERT INTO dbo.Readings (ReadingID, Station, Value)
SELECT TOP (1000000) n, n % 1000, n % 100
FROM (SELECT ROW_NUMBER() OVER (ORDER BY (SELECT NULL)) AS n FROM sys.all_objects AS a CROSS JOIN sys.all_objects AS b CROSS JOIN sys.all_objects AS c) AS t;
GO
CREATE OR ALTER PROCEDURE dbo.WaitsOf @batch nvarchar(max)
AS
BEGIN
    SET NOCOUNT ON;
    DECLARE @before TABLE (wait_type nvarchar(60) PRIMARY KEY, tasks bigint, ms bigint);
    INSERT @before SELECT wait_type, waiting_tasks_count, wait_time_ms FROM sys.dm_exec_session_wait_stats WHERE session_id = @@SPID;
    EXEC (@batch);
    SELECT w.wait_type, w.waiting_tasks_count - ISNULL(b.tasks, 0) AS Tasks, w.wait_time_ms - ISNULL(b.ms, 0) AS WaitMs
    FROM sys.dm_exec_session_wait_stats AS w
    LEFT JOIN @before AS b ON b.wait_type = w.wait_type
    WHERE w.session_id = @@SPID
      AND w.wait_type IN (N'CXPACKET', N'CXCONSUMER', N'SOS_SCHEDULER_YIELD', N'ASYNC_IO_COMPLETION')
      AND w.waiting_tasks_count - ISNULL(b.tasks, 0) > 0
    ORDER BY w.wait_type;
END;
CXPACKET: Parallel Threads Wait on Each Other
A parallel query splits its work across several threads, and the threads pass rows to each other. A thread that has to wait for a partner waits on a parallel wait type. Since SQL Server 2016 SP2 and 2017 CU3, the harmless side of that wait has its own name, CXCONSUMER. CXPACKET keeps the rest. The next script runs a parallel sort of a million rows with four threads. The hint asks for a parallel plan, so even a small server shows the waits.
EXEC dbo.WaitsOf N'DECLARE @x bigint;
SELECT @x = COUNT_BIG(*) FROM (SELECT TOP (1000000) ReadingID, Value FROM dbo.Readings ORDER BY Value, ReadingID) AS s
OPTION (MAXDOP 4, USE HINT(''ENABLE_PARALLEL_PLAN_PREFERENCE''));';| wait_type | Tasks | WaitMs |
|---|---|---|
| CXCONSUMER | 2192 | 62 |
| CXPACKET | 2 | 0 |
| SOS_SCHEDULER_YIELD | 92 | 57 |
These numbers come from my test server and change from run to run. CXCONSUMER appears every time and has the most tasks, because it is the normal side of a parallel plan. CXPACKET shows a few short waits in most runs. On a real server, skewed work makes CXPACKET grow. A parallel query is not a problem by itself. It becomes one when the waits are long. Many parallel queries that compete for processors do the same. Check MAXDOP, the cost threshold for parallelism and the statistics.
A second server counted more tasks, 2,795 for CXCONSUMER against 2,192.
SOS_SCHEDULER_YIELD: A CPU Bound Task Gives Way
A task uses a processor for a short slice, and then it must yield so that others can run. When it yields and goes back to the queue, it records SOS_SCHEDULER_YIELD. A task that only computes, with no reads and no locks, produces many of these. The script below runs a loop that does arithmetic and nothing else.
EXEC dbo.WaitsOf N'DECLARE @i int = 0, @acc bigint = 0;
WHILE @i < 3000000 BEGIN SET @acc += @i % 7; SET @i += 1; END;';
| wait_type | Tasks | WaitMs |
|---|---|---|
| SOS_SCHEDULER_YIELD | 704 | 4 |
The task yielded 704 times and waited 4 ms in total. A second server counted 1,282 yields. Each wait is tiny, because nobody else wanted the processor. On a busy server the same yields queue behind other tasks, and the signal share of the wait rises. This wait is the sign of CPU work. It shows queries that compute a lot, and a server that has too few processors for them.
ASYNC_IO_COMPLETION: Work That Waits on Disk
This wait covers asynchronous input and output that is not a data page read. Backups, restores and file operations produce it. A good way to see it is to create a database with a large log file. SQL Server zeroes the log before it uses it. The script below creates a database named AsyncIoWaitDemo with a log of 1 GB.
DECLARE @path nvarchar(260) = CONVERT(nvarchar(260), SERVERPROPERTY('InstanceDefaultDataPath'));
DECLARE @sql nvarchar(1000) = N'CREATE DATABASE AsyncIoWaitDemo
ON PRIMARY (NAME = AsyncIoWaitDemo, FILENAME = ''' + @path + N'AsyncIoWaitDemo.mdf'', SIZE = 8MB)
LOG ON (NAME = AsyncIoWaitDemo_log, FILENAME = ''' + @path + N'AsyncIoWaitDemo_log.ldf'', SIZE = 1GB);';
EXEC dbo.WaitsOf @sql;| wait_type | Tasks | WaitMs |
|---|---|---|
| ASYNC_IO_COMPLETION | 1 | 333 |
| SOS_SCHEDULER_YIELD | 4 | 0 |
The statement waited 333 ms for the disk to write a gigabyte of zeros. Other runs gave between 0.3 and 1.8 seconds. A slow disk makes the wait longer. A server side cursor over the same million rows recorded no ASYNC_IO_COMPLETION. A slow client reading rows shows up as ASYNC_NETWORK_IO, which is a different wait. Here the cause is backup and file work.
Are Another Server’s Top Three Wait Stats Useful?
You could argue that a list from other people’s servers says nothing about yours. That is true. It only tells you which questions come up first. Your own counters decide, and a different wait can lead the list on your server. The post Waits Since Restart: A Wait Stats Query With Uptime Rates lists your own waits. I read the top waits first and then check the three here, because they led the lists that people sent.
What to Remember
The top three wait stats point at parallel work, CPU work and disk work. CXPACKET and CXCONSUMER mean parallel work, and only long or skewed waits are a problem. SOS_SCHEDULER_YIELD means a task that computes, and a rising signal share means a busy processor. ASYNC_IO_COMPLETION means backups and file work. To check any wait, count the session waits before and after a statement, and read the difference.
When you finish, run the cleanup script. It removes the demo databases.
USE master;
GO
IF DB_ID(N'AsyncIoWaitDemo') IS NOT NULL
BEGIN
    ALTER DATABASE AsyncIoWaitDemo SET SINGLE_USER WITH ROLLBACK IMMEDIATE;
    DROP DATABASE AsyncIoWaitDemo;
END;
ALTER DATABASE WaitSamplesDemo SET SINGLE_USER WITH ROLLBACK IMMEDIATE;
DROP DATABASE WaitSamplesDemo;
A top wait is not a bad sign, it is the first question to ask.
Published by Pinal Dave on SQLAuthority. More of my work at pinaldave.com.
Discover more from SQL Authority with Pinal Dave
Subscribe to get the latest posts sent to your email.