
Insert workload waits come down to two names, WRITELOG and PAGELATCH_EX. A test with 16 connections shows both within seconds.

Where Does the Time Go?
A common first question after an insert test is where the time went. The answer sits in the wait statistics. This post reads the insert workload waits of a test that anyone can repeat. If you haven’t run a load test yet, start with oStress Load Test: Run Many Sessions Against SQL Server.
In my health checks, I use oStress for this kind of test. A few switches create a multi-threaded workload, and the test table stays simple. Here, 16 connections insert one row at a time, 10,000 rows each. Every insert is its own transaction. That is the hardest case for the transaction log, which makes it a good teaching case.
Set Up the Test
The setup builds a database and an insert table. The two worker tables keep what each connection reports about itself, so the numbers survive after the connections close.
IF DB_ID(N'InsertWaitsDemo') IS NULL CREATE DATABASE InsertWaitsDemo;
GO
USE InsertWaitsDemo;
GO
DROP TABLE IF EXISTS dbo.GateLog, dbo.WorkerRuns, dbo.WorkerWaits;
CREATE TABLE dbo.GateLog (
    GateLogId int          IDENTITY(1,1) NOT NULL CONSTRAINT PK_GateLog PRIMARY KEY CLUSTERED,
    Note      varchar(500) NOT NULL CONSTRAINT DF_GateLog_Note DEFAULT ('Visitor counted at the gate')
);
CREATE TABLE dbo.WorkerRuns (
    SessionId int          NOT NULL,
    StartedAt datetime2(3) NOT NULL,
    EndedAt   datetime2(3) NULL
);
CREATE TABLE dbo.WorkerWaits (
    SessionId int           NOT NULL,
    WaitType  nvarchar(60)  NOT NULL,
    WaitMs    bigint        NOT NULL
);
Run the Workers
Each worker notes its start time and inserts 10,000 rows. It then notes its end time and copies its own waits from sys.dm_exec_session_wait_stats. That view keeps wait statistics per session. For more on it, read Session Wait Stats: Find the Query Behind a Wait Type. It needs the VIEW SERVER STATE permission (VIEW SERVER PERFORMANCE STATE on SQL Server 2022 and later). Save the worker as worker.sql.
SET NOCOUNT ON;
INSERT dbo.WorkerRuns (SessionId, StartedAt) VALUES (@@SPID, SYSDATETIME());
GO
INSERT dbo.GateLog DEFAULT VALUES;
GO 10000
UPDATE dbo.WorkerRuns SET EndedAt = SYSDATETIME() WHERE SessionId = @@SPID AND EndedAt IS NULL;
INSERT dbo.WorkerWaits (SessionId, WaitType, WaitMs)
SELECT @@SPID, wait_type, wait_time_ms
FROM sys.dm_exec_session_wait_stats
WHERE session_id = @@SPID;
The launcher starts 16 sqlcmd processes at once and waits until all of them finish.
$server  = '.\SQLDEV'
$workers = 16
$watch = [Diagnostics.Stopwatch]::StartNew()
1..$workers | ForEach-Object {
    Start-Process sqlcmd -ArgumentList "-S $server -E -C -d InsertWaitsDemo -i worker.sql -o NUL" -WindowStyle Hidden -PassThru
} | Wait-Process
'{0:N1} seconds with {1} workers' -f $watch.Elapsed.TotalSeconds, $workers
You can start the same crowd with oStress. Its sessions end with the run, so you can’t read their session waits afterwards. Take a snapshot of the server’s waits before the run and subtract it after the run. Don’t clear the counters with DBCC SQLPERF on a shared server, because that resets them for everyone.
ostress -S.\SQLDEV -E -d InsertWaitsDemo -Q"INSERT dbo.GateLog DEFAULT VALUES;" -n16 -r10000 -q
DROP TABLE IF EXISTS dbo.WaitsBefore;
SELECT wait_type, wait_time_ms
INTO dbo.WaitsBefore
FROM sys.dm_os_wait_stats;
SELECT w.wait_type,
       CAST((w.wait_time_ms - b.wait_time_ms) / 1000.0 AS decimal(10, 1)) AS WaitSeconds
FROM sys.dm_os_wait_stats AS w
JOIN dbo.WaitsBefore AS b ON b.wait_type = w.wait_type
WHERE w.wait_type IN (N'WRITELOG', N'PAGELATCH_EX', N'PAGELATCH_SH', N'LOGMGR_FLUSH')
ORDER BY w.wait_time_ms - b.wait_time_ms DESC;
The snapshot counts every session on the server. Use it on a quiet test server. In a run of 4,000 inserts per connection, it listed WRITELOG at 27.7 seconds and PAGELATCH_EX at 21.9 seconds. The session waits of the workers came out close to the same two numbers.
Read the Result
Count the sessions and the elapsed time first. Then rank the waits of all 16 sessions together.
SELECT COUNT(*) AS Sessions,
       CAST(DATEDIFF(MILLISECOND, MIN(StartedAt), MAX(EndedAt)) / 1000.0 AS decimal(8, 1)) AS ElapsedSeconds
FROM dbo.WorkerRuns;

SELECT TOP (4) WaitType,
       CAST(SUM(WaitMs) / 1000.0 AS decimal(10, 1)) AS WaitSeconds,
       CAST(100.0 * SUM(WaitMs) / SUM(SUM(WaitMs)) OVER () AS decimal(5, 1)) AS PercentOfWait
FROM dbo.WorkerWaits
GROUP BY WaitType
ORDER BY SUM(WaitMs) DESC;| Sessions | ElapsedSeconds |
|---|---|
| 16 | 20.4 |
| WaitType | WaitSeconds | PercentOfWait |
|---|---|---|
| WRITELOG | 87.4 | 50.0 |
| PAGELATCH_EX | 76.9 | 44.1 |
| LATCH_SH | 4.3 | 2.5 |
| LATCH_EX | 2.2 | 1.2 |
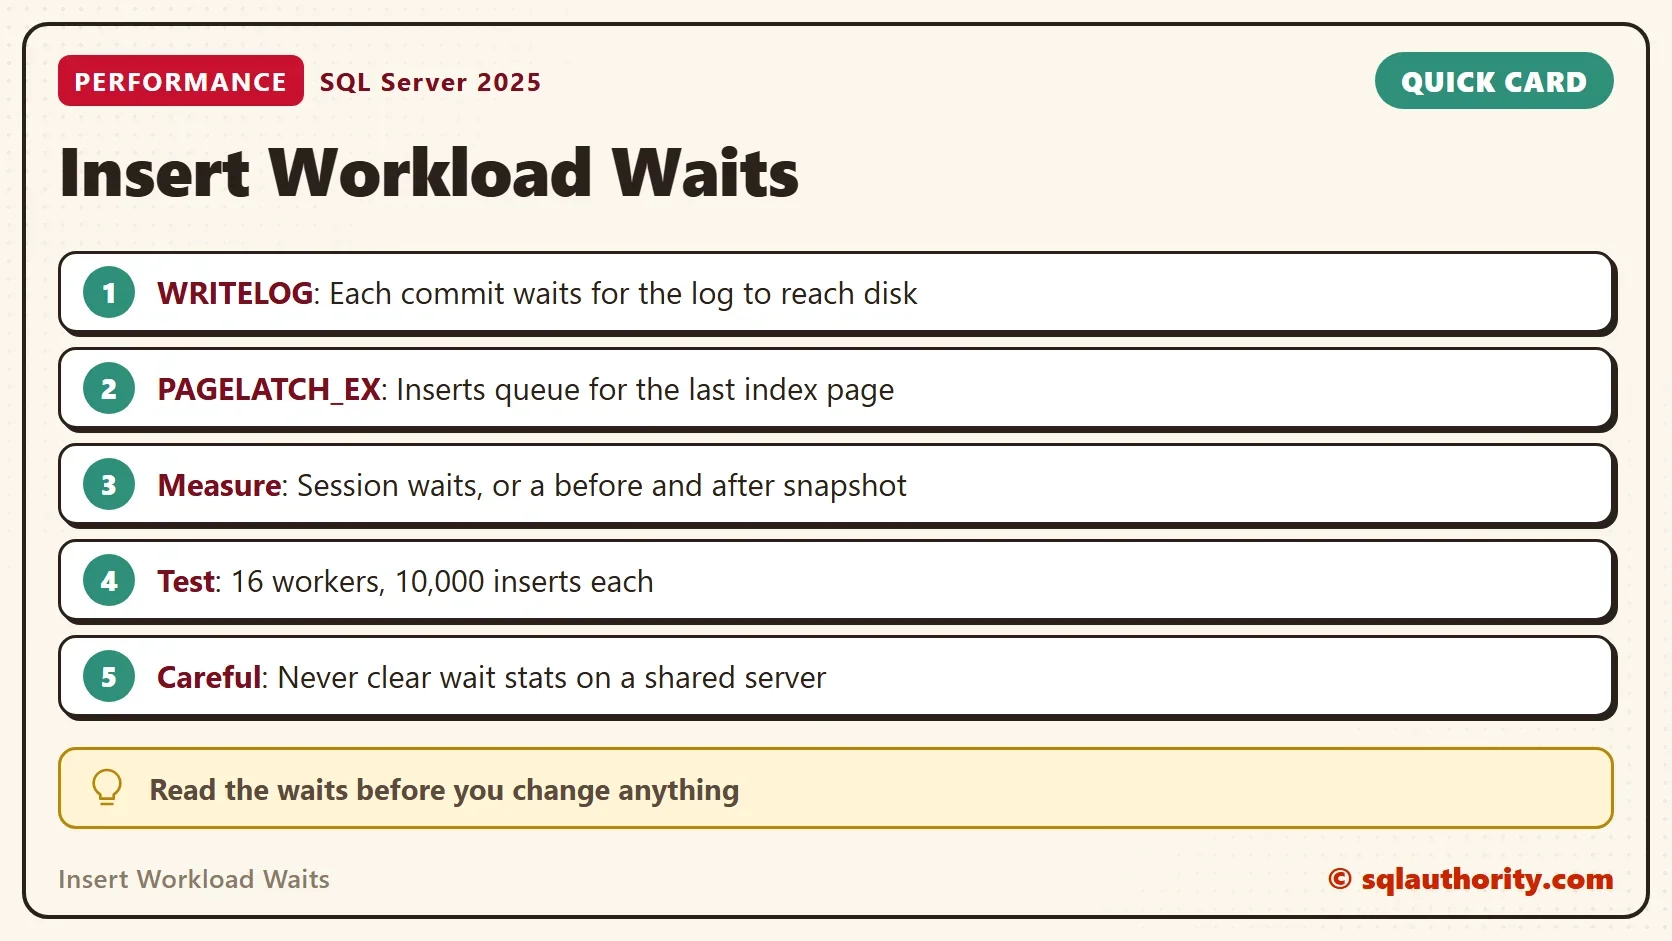
The wait seconds add up across all 16 sessions, so 87 seconds of waiting fit inside a 20 second run. An earlier run on a busier moment took 81 seconds. WRITELOG held 63 percent of the waits and PAGELATCH_EX held 31 percent. The shares moved, and the order of the two top waits stayed.
What WRITELOG Means
A commit isn’t finished until its log records reach the disk. One row per transaction means one log flush per row, and 16 sessions queue for the same log. The cheapest fix is fewer commits. In a single-session test, 10,000 inserts in one transaction took about 0.1 seconds. The same inserts sent as 10,000 separate batches, with a commit each, took between 3 and 6 seconds.
A faster log drive helps too. The recovery model doesn’t change how much log these inserts write. Recovery Model Insert Test: FULL vs SIMPLE Under Load tests that.
What PAGELATCH_EX Means
The table has a clustered primary key on an identity column. Every new row goes to the last page of that index. A session needs an exclusive latch on that page for the moment of the insert. So 16 sessions form a line. A latch is a lightweight hold on a page in memory, lighter than a lock. The original test used a table with no key, a heap, and still showed PAGELATCH_EX. The Nonclustered Primary Key post below measures that layout.
Two later posts test fixes. One is OPTIMIZE_FOR_SEQUENTIAL_KEY: Test the Last Page Insert Fix. The other is Nonclustered Primary Key Test: Last Page Insert Waits. Neither fix is free, so read the results before you copy either one. For the whole server, run the script in Wait Stats Collection Script for Current SQL Server Versions.
You could argue that 16 workers on one table is a made-up case. It is. Real inserts rarely arrive at that rate into one table. The test isolates the two waits so you can recognize them when a real workload shows them. Recognizing them is the skill.
What to Remember
Insert workload waits of this kind come mostly from the log and from the last page of the index. Measure the waits per session or with a before and after snapshot. Never clear the counters on a shared server.
When you finish, drop the demo database.
USE master;
GO
ALTER DATABASE InsertWaitsDemo SET SINGLE_USER WITH ROLLBACK IMMEDIATE;
DROP DATABASE InsertWaitsDemo;
A slow insert is not a mystery, it is two lines: one at the log, one at the last page.
Published by Pinal Dave on SQLAuthority. More of my work at pinaldave.com.
Discover more from SQL Authority with Pinal Dave
Subscribe to get the latest posts sent to your email.




2 Comments. Leave new
Wonderfully explained Pinal! Very useful article!
However, I have a quick question on Fixing PAGELATCH_EX wait type. The table you have referred in the test do not have a Primary Key specified on it, but it has an Identity column. In this case and in other cases how we can reduce the congestion while inserting a Primary Key?
Hi Brahmanand,
Very good question. The reason, I did not create PK on it because if I would have created it, the common assumption would have been that is the cause of the PAGELATCH_EX wait type. In our case, we are getting that even without Primary Key.
The solution which you will apply for the PAGELATCH_EX wait type without Primary Key will also help if you have a Primary Key on the table as well. If you are using SQL Server 2019 there is one more way you can help improve Identity Key Column and I will blog about them in the future.