
Session wait stats tell you which session produced a wait type. The input buffer then tells you which query that session ran. That answers the question the server totals can’t.

Server Totals Don’t Name a Query
A wait statistics script tells you what the server waits for, such as THREADPOOL, locks or disk. It adds up the whole instance. It never tells you which query waited. No DMV lists queries by wait type, so you build the answer in two steps. First find the session that has the wait. Then read its query.
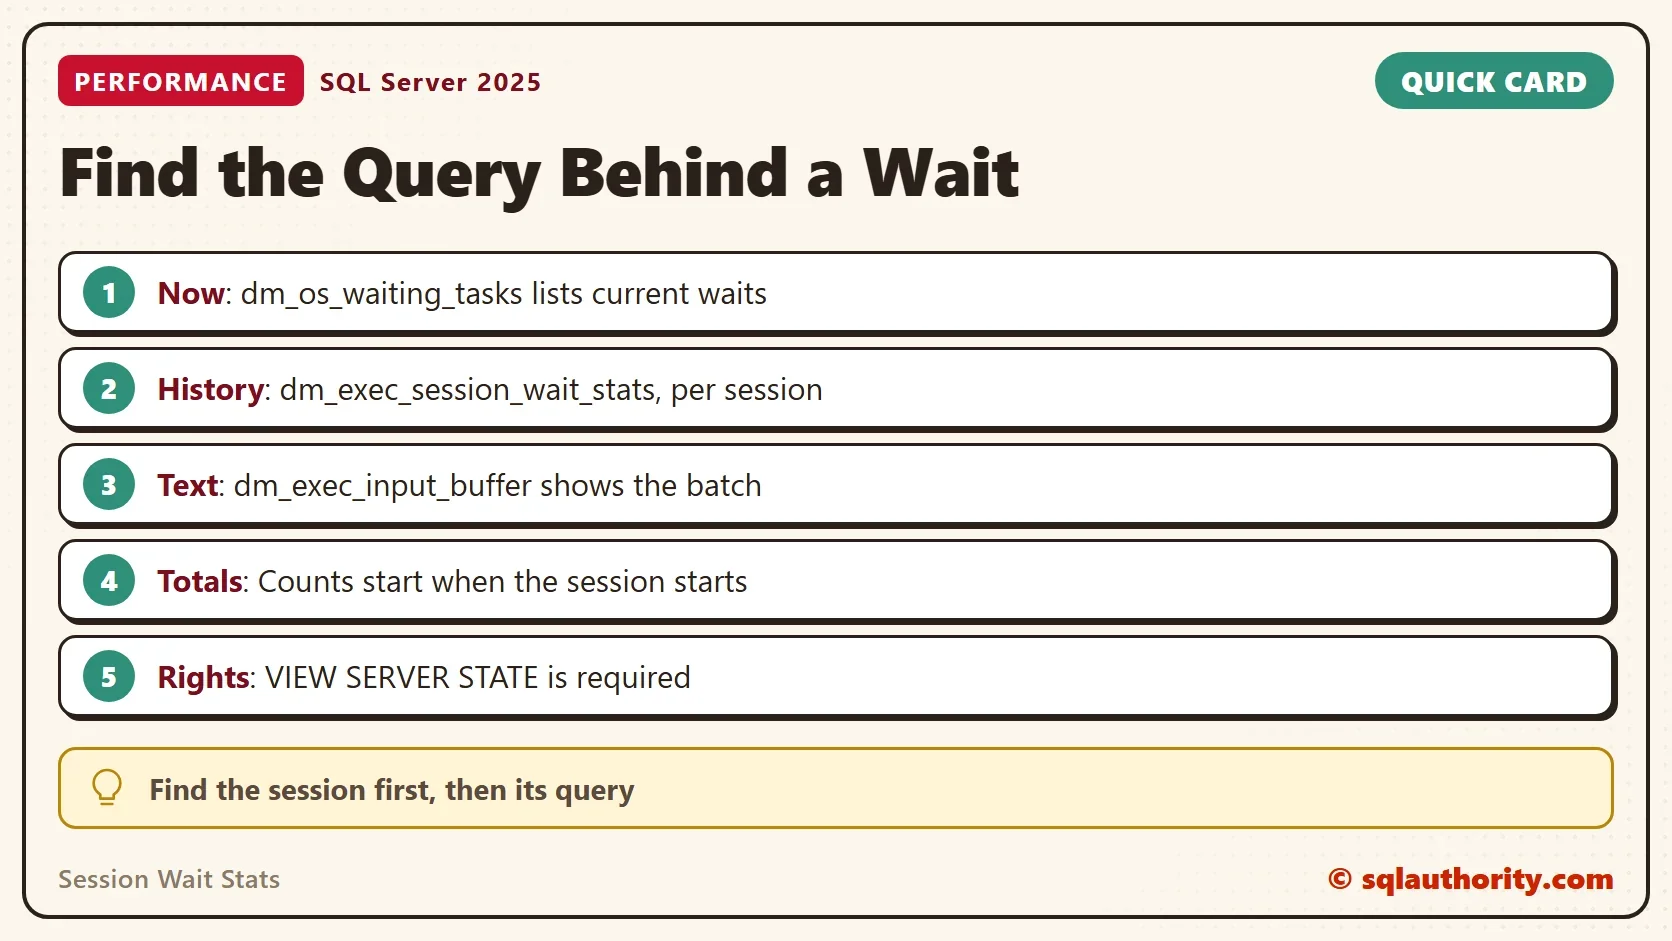
Two views give you the sessions. sys.dm_os_waiting_tasks shows who waits right now. sys.dm_exec_session_wait_stats shows the waits each session has collected since it connected. The demo creates a wait on purpose with WAITFOR, which is a wait type like any other. It creates nothing in any database. You need two query windows.
See Who Waits Right Now
In window 1, start a wait that lasts fifteen seconds.
WAITFOR DELAY '00:00:15';
In window 2, run the query below while window 1 is still waiting. It joins the waiting tasks to the sessions, and it adds the text of the statement that is running.
DECLARE @WaitType nvarchar(60) = N'WAITFOR';
SELECT wt.session_id, wt.wait_type, wt.wait_duration_ms, wt.blocking_session_id,
       SUBSTRING(st.text, 1, 40) AS StatementStart
FROM sys.dm_os_waiting_tasks AS wt
JOIN sys.dm_exec_sessions AS es ON es.session_id = wt.session_id
LEFT JOIN sys.dm_exec_requests AS r ON r.session_id = wt.session_id
OUTER APPLY sys.dm_exec_sql_text(r.sql_handle) AS st
WHERE wt.wait_type = @WaitType
AND es.is_user_process = 1;| session_id | wait_type | wait_duration_ms | blocking_session_id | StatementStart |
|---|---|---|---|---|
| 56 | WAITFOR | 3032 | NULL | WAITFOR DELAY ’00:00:15′; |
Your session number and your milliseconds will differ. The row names the session, the wait type, how long it has waited and the statement. A blocking session number would appear in the fourth column if a lock held the session up. Replace WAITFOR with the wait type you are chasing.
Read the Wait History of a Session
Waiting tasks show only the present. A session that waited a minute ago has nothing there. For history, read sys.dm_exec_session_wait_stats. It keeps a row for every wait type that a session has met since it connected. The next query joins it to sys.dm_exec_sessions, and it asks sys.dm_exec_input_buffer for the last batch of each session.
DECLARE @WaitPattern nvarchar(60) = N'WAITFOR';
SELECT w.session_id, w.wait_type, w.waiting_tasks_count AS Waits,
       w.wait_time_ms AS WaitMs, w.signal_wait_time_ms AS SignalMs,
       w.max_wait_time_ms AS LongestWaitMs, es.status,
       LEFT(REPLACE(REPLACE(ib.event_info, CHAR(13), N' '), CHAR(10), N' '), 60) AS LastBatch
FROM sys.dm_exec_session_wait_stats AS w
JOIN sys.dm_exec_sessions AS es ON es.session_id = w.session_id
CROSS APPLY sys.dm_exec_input_buffer(w.session_id, NULL) AS ib
WHERE w.wait_type LIKE @WaitPattern
  AND es.is_user_process = 1
  AND w.session_id <> @@SPID
ORDER BY w.wait_time_ms DESC;| session_id | wait_type | Waits | WaitMs | SignalMs | LongestWaitMs | status | LastBatch |
|---|---|---|---|---|---|---|---|
| 56 | WAITFOR | 1 | 15013 | 0 | 15013 | sleeping | WAITFOR DELAY ’00:00:15′; |
Window 1 has finished, so its session sleeps. Its history still shows one wait of about 15 seconds with no signal time. The last batch is the WAITFOR statement. That is the query behind the wait.
The query uses LIKE, so a pattern such as N’%THREADPOOL%’ works too. Session wait stats are cumulative, so a long-lived session carries every wait since it connected. The column WaitMs already includes SignalMs. The difference is the time spent waiting for the resource itself. The signal part is the time spent waiting for a CPU afterward. The query joins the views and doesn’t use IN with a subquery. A subquery used with IN must return a single column. A select list of several columns raises Msg 116.
A Real Case: THREADPOOL
On one client server, THREADPOOL made up about 85 percent of all waits. The wait means a task waited for a free worker thread. Every request needs a worker, and a long blocking chain or a burst of new connections can use them all. The session wait statistics showed which sessions had collected the wait. Their input buffers showed which queries they ran.
The fix starts with the sessions. Find the head of the blocking chain, or the application that opens too many connections. Raising the worker limit doesn’t remove the cause, it only hides it. The limit and its formula are in Optimal Value for Max Worker Threads in SQL Server.
Limits to Know
Both views need the VIEW SERVER STATE permission, or VIEW SERVER PERFORMANCE STATE on SQL Server 2022 and later. The session view needs SQL Server 2016. It lists only open sessions. When a session closes, its numbers go with it. The input buffer shows the last batch the session sent. It can be a different query than the one that waited.
Is There a Better Tool?
You could argue that Query Store or an Extended Events session is the better tool. They keep history after a session closes, and they show the exact statement. That is true. They need setup before the problem happens. The views above need nothing, so they work in the middle of an incident. They need no setup, so use them first in an incident and set up the heavier tools afterward.
What to Remember
Session wait stats connect a wait type to a session. Use sys.dm_os_waiting_tasks for the present and sys.dm_exec_session_wait_stats for the history. Join to sys.dm_exec_input_buffer or sys.dm_exec_sql_text for the query. Check the head of any blocking chain before you touch a setting.
Nothing was created, so there is nothing to clean up. Close window 1 and window 2 when you finish.
A wait type is not a culprit, it is a symptom. The session behind it leads you to the query.
Published by Pinal Dave on SQLAuthority. More of my work at pinaldave.com.
Discover more from SQL Authority with Pinal Dave
Subscribe to get the latest posts sent to your email.




2 Comments. Leave new
Curious to know what was causing this wait, was it a config issue?
Got this error: Msg 116, Level 16, State 1, Line 10
Only one expression can be specified in the select list when the subquery is not introduced with EXISTS.
Changing the subquery to a JOIN will fix this.
(used with waitttype “%MEMORY_ALLOCATION_EXT%” which gave 2 waittypes, SQL2019 RC1)