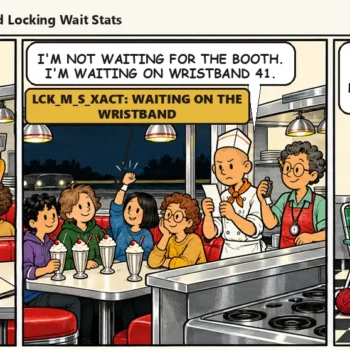
CXPACKET waits are normal when SQL Server runs parallel queries, but uneven parallelism can leave one worker processing nearly every row while others wait. The useful evidence is per-thread work in the actual plan, not a server-wide wait total alone. Find the skew before changing MAXDOP.

Read the Two Wait Names Carefully
Parallel exchange operators coordinate producers and consumers. CXPACKET and CXCONSUMER can appear during healthy parallel work. Their split helps describe coordination, but neither wait name proves a bad plan. A wait total accumulated since restart says little about the one report that slowed this morning. Compare a measured interval with CPU and user latency.
I have watched a team set MAXDOP to 1 after seeing CXPACKET at the top of a chart. The report got slower because it still had to read the same rows on one worker. Which operator gave one thread too much work? That is the question to answer before choosing a setting.
Find the Query Behind the Uneven Parallelism
Use Query Store or an incident capture to identify statements with high duration and parallel plans in the same period. sys.dm_exec_requests shows active requests, while sys.dm_os_waiting_tasks can show waits at task level. Connect those views to a specific session and plan. A server-wide ratio cannot identify the skewed operator.
SELECT r.session_id, r.request_id, r.status,
       r.wait_type, r.cpu_time, r.total_elapsed_time,
       r.dop, t.text AS batch_text
FROM sys.dm_exec_requests AS r
JOIN sys.dm_exec_sessions AS s
  ON s.session_id = r.session_id
OUTER APPLY sys.dm_exec_sql_text(r.sql_handle) AS t
WHERE s.is_user_process = 1 AND r.dop > 1
ORDER BY r.total_elapsed_time DESC;
Use the relevant server-state permission. The dop column is available on modern supported versions. Capture the actual execution plan for a representative slow run, not only the estimated plan. The estimated plan has no observed rows per thread.
Spot Uneven Parallelism in Per-Thread Rows
In SSMS, open the actual plan, inspect parallel scan, join, and exchange operators, and view runtime counters for each thread. If one worker reads almost all input rows and the others read few, the work distribution is skewed. Compare Actual Rows with Estimated Rows at the same operator and inspect whether the skew begins before or after a repartition exchange.
A one-thread final gather is expected; it is not evidence that scan work was uneven. Focus on the producers feeding the exchange. A bad estimate can choose the wrong distribution or join strategy. A large key value concentrated in one partition can make one worker do most of a hash join. Save the operator IDs and row counts so the diagnosis is reproducible.
Sample Live Query Profiles
For a long-running query, sys.dm_exec_query_profiles can expose node_id, thread_id, physical operator, and row_count while the plan executes when profiling is available. Group or sort by node and thread; compare rows for the same node only. This read-only query is a live snapshot, so run it while the affected request is active.
DECLARE @session_id int = 57;
SELECT node_id, physical_operator_name, thread_id,
       row_count, estimate_row_count,
       elapsed_time_ms
FROM sys.dm_exec_query_profiles
WHERE session_id = @session_id
ORDER BY node_id, thread_id;
Confirm the columns and profiling support on the target SQL Server version. A completed query disappears from this live view; use an actual plan capture for later review. The row counts are moving while the query runs, so take more than one sample and note the time. A single early snapshot can show temporary imbalance that evens out by completion.

Refresh Statistics When Estimates Are Stale
Compare estimated and actual rows at the operator that starts the imbalance. If statistics are stale or the data distribution changed, update the relevant statistics with an appropriate sample and retest. A filtered statistic or different key order can represent a skewed subset better than a broad average. Do not update every statistic on the server because one query was slow.
SELECT s.name, STATS_DATE(s.object_id, s.stats_id) AS updated_at
FROM sys.stats AS s
WHERE s.object_id = OBJECT_ID(N'dbo.FactSales')
ORDER BY updated_at;
The date alone does not prove freshness; compare modification volume and histogram shape. A statistic updated yesterday can still miss a newly dominant key. I keep the before and after plan with actual per-thread rows. A lower elapsed time can then be tied to a specific improvement, not merely a quieter test run.
Consider Join Shape and Distribution
A hash join can skew when one join key dominates. A nested loops or merge join can perform better for a selective or ordered input, but a forced join hint can create a new problem for other parameters. First test rewritten predicates, useful indexes, and accurate statistics. Then compare alternate plan shapes on representative values.
A repartition exchange can distribute rows by a hash key. If the key is heavily skewed, many rows can land on one worker. Splitting a special value into a separate branch or changing the join strategy can help when the business logic supports it. Keep output equivalence tests beside performance numbers.
Test a Query-Level MAXDOP Change
If the work remains uneven and the overhead of many workers exceeds the benefit, test a lower MAXDOP for that statement. The OPTION clause goes at the end of the full statement, as in this copy of a sales total. This is a local experiment, not a server-wide reaction to a wait chart. Compare duration, CPU, reads, and concurrency at typical and peak input sizes. A lower degree can reduce coordination while increasing elapsed time for a genuinely parallel scan.
-- A tested copy of the affected statement, hint at the end:
SELECT f.StoreID, SUM(f.Amount) AS total_amount
FROM dbo.FactSales AS f
GROUP BY f.StoreID
OPTION (MAXDOP 4);
I close the case by recording the original wait window, per-thread rows, changed statistics or plan shape, and new measurements. CXPACKET is a signpost. The operator-level row distribution tells you whether the workers shared the task or uneven parallelism left one doing most of it.
Tell Temporary From Persistent Uneven Parallelism
Not every unequal snapshot is a problem. A scan can assign chunks to workers at different times; one sample taken early can look extreme and later converge. The actual completed plan is stronger evidence for total rows processed by each thread. If the skew persists, compare rows and elapsed time at the same operator node. Also check whether a blocking wait, memory spill, or slow storage read held one producer back. That is a resource problem, not necessarily a hash-distribution problem.
When a parallel plan changes after a statistics update, repeat it across several parameters. A plan that balances one common value can skew badly for a rare or dominant value. Query Store's runtime history can show whether the new shape improves the distribution of durations, even when its average is unchanged. The goal is stable user latency, not merely a prettier worker chart.
Related reading on this blog: Parallelism and Threads with No Work and SQL SERVER Performance: When MAXDOP = 1 Slowed Down the Entire Business.

A parallel wait is not a setting command, it is a clue to uneven work in the query.
Published by Pinal Dave on SQLAuthority. More of my work at pinaldave.com.
Discover more from SQL Authority with Pinal Dave
Subscribe to get the latest posts sent to your email.