RESOURCE_SEMAPHORE vs THREADPOOL is a question about what a task is waiting for. One wait means a query cannot start because there is no memory for it. The other means a task cannot run because there is no worker thread. The two waits sound alike, and the fixes have almost nothing in common.

What Each Wait Means
A query that sorts or hashes asks SQL Server for a memory grant before it starts. When the memory is not free, the query waits with RESOURCE_SEMAPHORE. It has not begun to execute, so it reads no data. The wait points at memory, and RESOURCE_SEMAPHORE vs THREADPOOL starts here. A similar name, RESOURCE_SEMAPHORE_QUERY_COMPILE, is a different wait that belongs to compiling a query.
A task also needs a worker thread to run. SQL Server owns a limited number of them, and the limit follows the number of processors. When every thread is busy, the next task waits with THREADPOOL. The wait points at threads, which means CPU, long queries or blocking.
Read Both Counters
The view sys.dm_os_wait_stats counts every wait since the last restart. The query below reads these two and adds the average wait per task.
SELECT wait_type, waiting_tasks_count AS Tasks, wait_time_ms AS WaitMs,
       CAST(wait_time_ms * 1.0 / NULLIF(waiting_tasks_count, 0) AS decimal(12,2)) AS AvgMs
FROM sys.dm_os_wait_stats
WHERE wait_type IN (N'RESOURCE_SEMAPHORE', N'THREADPOOL')
ORDER BY wait_type;| wait_type | Tasks | WaitMs | AvgMs |
|---|---|---|---|
| RESOURCE_SEMAPHORE | 0 | 0 | NULL |
| THREADPOOL | 6230 | 13741 | 2.21 |
The numbers come from the test server and grow while it runs. They show a clear difference. On this server nothing has waited for a memory grant, and thousands of tasks have waited for a thread. A count above zero for either wait is a signal. Here the average wait is 2.21 ms and the queue is empty. These counts are history, not a present problem. A count that grows between two readings is a problem that is happening now.
Is It Happening Right Now?
The counters have history. Two more checks show the present. A query that waits for memory has a row in sys.dm_exec_query_memory_grants with no grant time. For threads, compare the worker limit with the workers in use. Then read the queue of tasks that wait for a thread.
SELECT COUNT(*) AS WaitingForMemory FROM sys.dm_exec_query_memory_grants WHERE grant_time IS NULL;
SELECT (SELECT max_workers_count FROM sys.dm_os_sys_info) AS MaxWorkers,
       (SELECT COUNT(*) FROM sys.dm_os_workers) AS WorkersNow,
(SELECT SUM(work_queue_count) FROM sys.dm_os_schedulers WHERE status = N'VISIBLE ONLINE') AS TasksWaitingForAThread;| WaitingForMemory |
|---|
| 0 |
| MaxWorkers | WorkersNow | TasksWaitingForAThread |
|---|---|---|
| 704 | 300 | 0 |
Both checks come back quiet on the test server. A server in trouble shows a count above zero in the first table. It can also show a queue above zero in the second. Check a few times, a few seconds apart, because a wait can come and go.
Fix RESOURCE_SEMAPHORE: Shrink the Grant
A memory wait means that queries ask for more memory than the server can hand out. The grant size comes from the plan. A sort or a hash join needs room for its rows, and the estimate of rows decides how much. Two fixes follow. Add an index so that the sort disappears, or correct the estimate so that the grant fits the work.
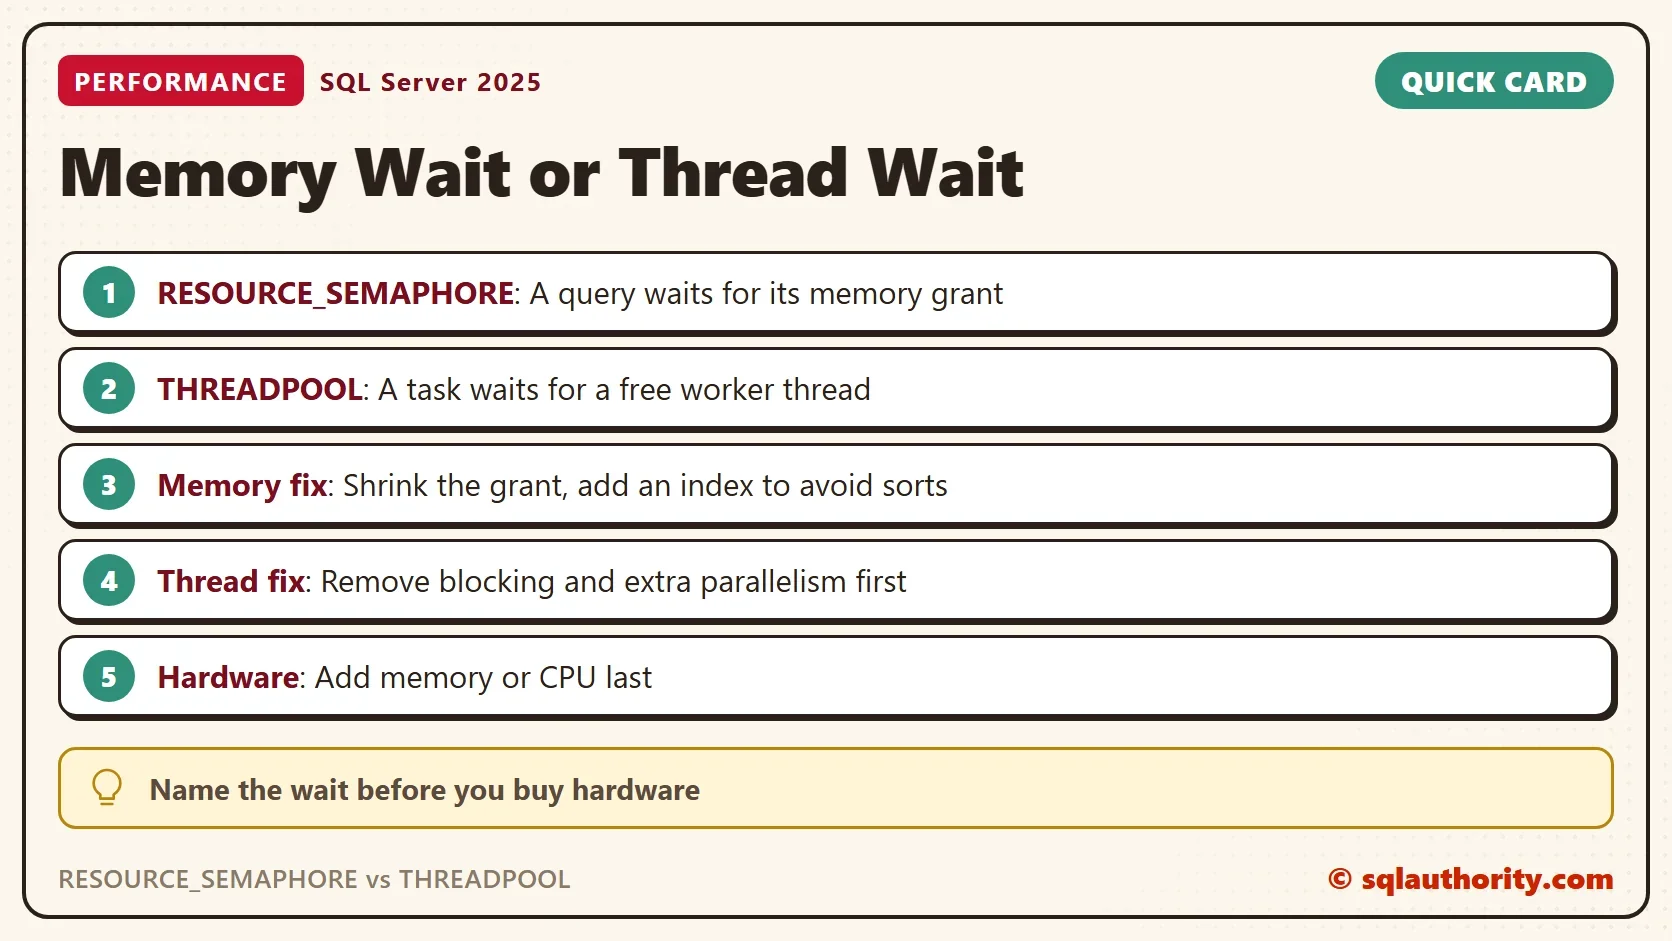
The demo shows the grant, not the wait. It creates a database named GrantSizeDemo with half a million rows. Run it on a test server.
IF DB_ID(N'GrantSizeDemo') IS NULL CREATE DATABASE GrantSizeDemo;
GO
USE GrantSizeDemo;
GO
DROP TABLE IF EXISTS dbo.Events;
CREATE TABLE dbo.Events (EventID int NOT NULL CONSTRAINT PK_Events PRIMARY KEY, Category int NOT NULL, Payload varchar(200) NOT NULL);
INSERT INTO dbo.Events (EventID, Category, Payload)
SELECT TOP (500000) n, n * 7919 % 100000, REPLICATE('x', 100)
FROM (SELECT ROW_NUMBER() OVER (ORDER BY (SELECT NULL)) AS n FROM sys.all_objects AS a CROSS JOIN sys.all_objects AS b CROSS JOIN sys.all_objects AS c) AS t;
The first query sorts all rows by a column without an index. The next script adds an index in the order of the sort and runs the same query again.
DECLARE @n bigint;
SELECT @n = COUNT_BIG(*) FROM (SELECT TOP (500000) EventID, Payload FROM dbo.Events ORDER BY Category, EventID) AS s /* GrantSizeDemoSort */ OPTION (MAXDOP 1);
CREATE INDEX IX_Events_Category ON dbo.Events (Category, EventID) INCLUDE (Payload);
GO
DECLARE @n bigint;
SELECT @n = COUNT_BIG(*) FROM (SELECT TOP (500000) EventID, Payload FROM dbo.Events ORDER BY Category, EventID) AS s /* GrantSizeDemoIdx */ OPTION (MAXDOP 1);
The plan cache keeps the grant of each query. The query below reads it. Each plan keeps the grant of its last run.
SELECT CASE WHEN st.text LIKE N'%GrantSizeDemoSort%' THEN N'Sort query' ELSE N'Indexed query' END AS QueryName,
       qs.last_grant_kb, qs.last_used_grant_kb
FROM sys.dm_exec_query_stats AS qs
CROSS APPLY sys.dm_exec_sql_text(qs.sql_handle) AS st
WHERE (st.text LIKE N'%GrantSizeDemoSort%' OR st.text LIKE N'%GrantSizeDemoIdx%') AND st.text NOT LIKE N'%dm_exec_query_stats%'
ORDER BY QueryName DESC;| QueryName | last_grant_kb | last_used_grant_kb |
|---|---|---|
| Sort query | 38216 | 25048 |
| Indexed query | 0 | 0 |
On my test server, the sort asked for about 37 MB and used about 24 MB. The indexed query asked for nothing, because the rows already come out in order. A second server gave other sizes. Its sort was granted about 68 MB, and its indexed query still got about 3 MB. So the index removes the sort and the grant drops to nothing or close to it. The sizes depend on the server.
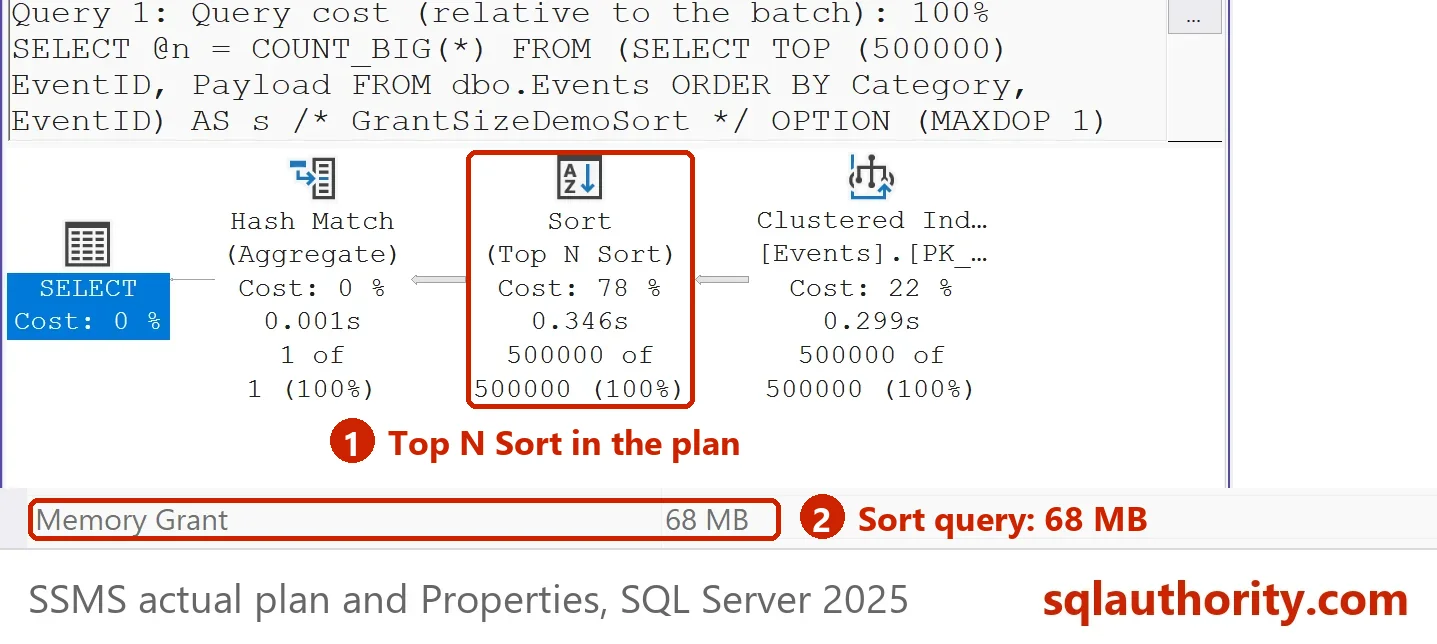
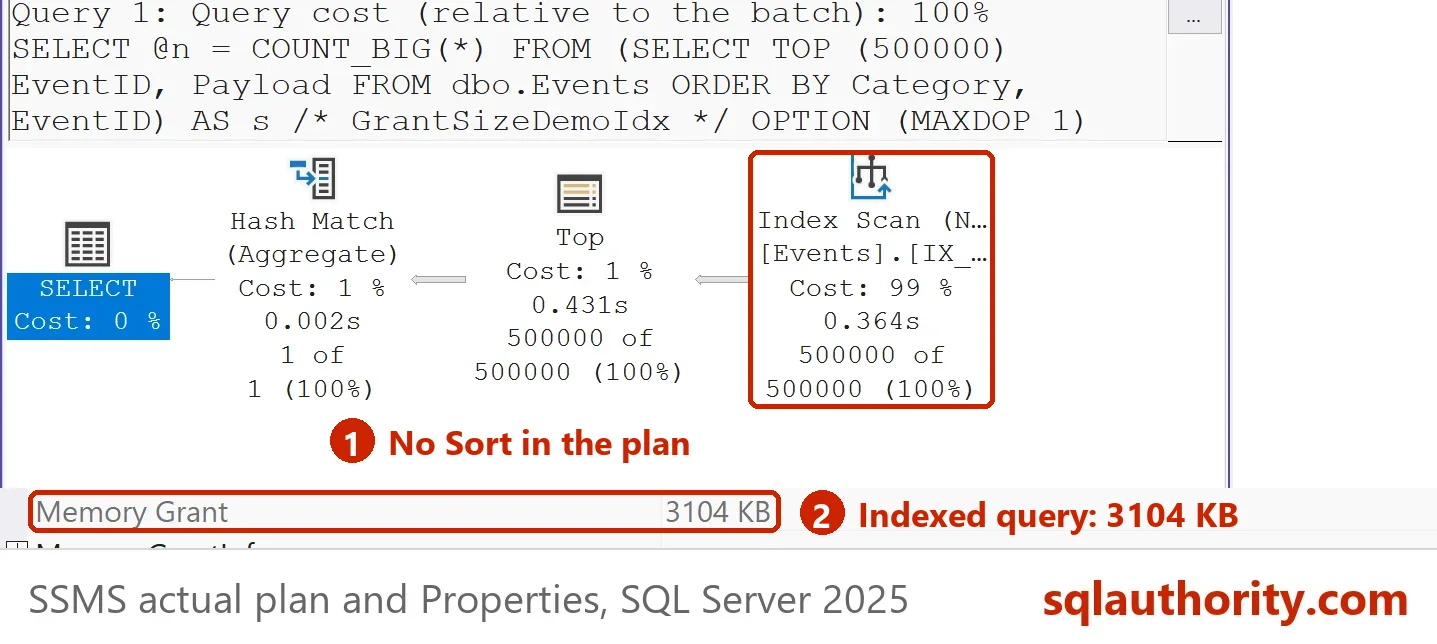
Multiply a big grant by a hundred sessions and you see how a memory wait starts. Fixing one such query does more than buying memory. Also update statistics when estimates are far off, because a grant follows the estimate.
Fix THREADPOOL: Free the Threads
A thread wait points at stuck threads, not at a pool that is too small. The stuck work is blocking, a slow query that holds a thread, or too much parallelism. Each parallel branch takes one thread per degree of parallelism. A few parallel queries can drain the pool. Look at blocking first. Then look at MAXDOP and the cost threshold for parallelism.
Raising the number of worker threads is the tempting fix, and it is the wrong first step. More threads need more memory and more switching, and they can make a server slower. The post THREADPOOL Waits: When Raising Max Worker Count Helps explains when the change is justified.
Should You Just Add Hardware?
You could argue that more memory or more CPU is the fastest fix. It is, and it also hides the cause. The load grows, and the same wait returns a month later with a bigger bill. I treat hardware as the last step, after the queries and the settings are clean. When the work is already tuned, the hardware is the honest answer.
What to Remember
RESOURCE_SEMAPHORE vs THREADPOOL decides where you look. A memory wait sends you to the largest grants, the sorts and the estimates. A thread wait sends you to blocking, long queries and parallelism. Read the counters, check the live views, and name the wait before you spend money.
When you finish, run the cleanup script. It removes the demo database.
USE master;
GO
ALTER DATABASE GrantSizeDemo SET SINGLE_USER WITH ROLLBACK IMMEDIATE;
DROP DATABASE GrantSizeDemo;
A wait is not a verdict on the server, it is a pointer to the cause.
Published by Pinal Dave on SQLAuthority. More of my work at pinaldave.com.
Discover more from SQL Authority with Pinal Dave
Subscribe to get the latest posts sent to your email.