
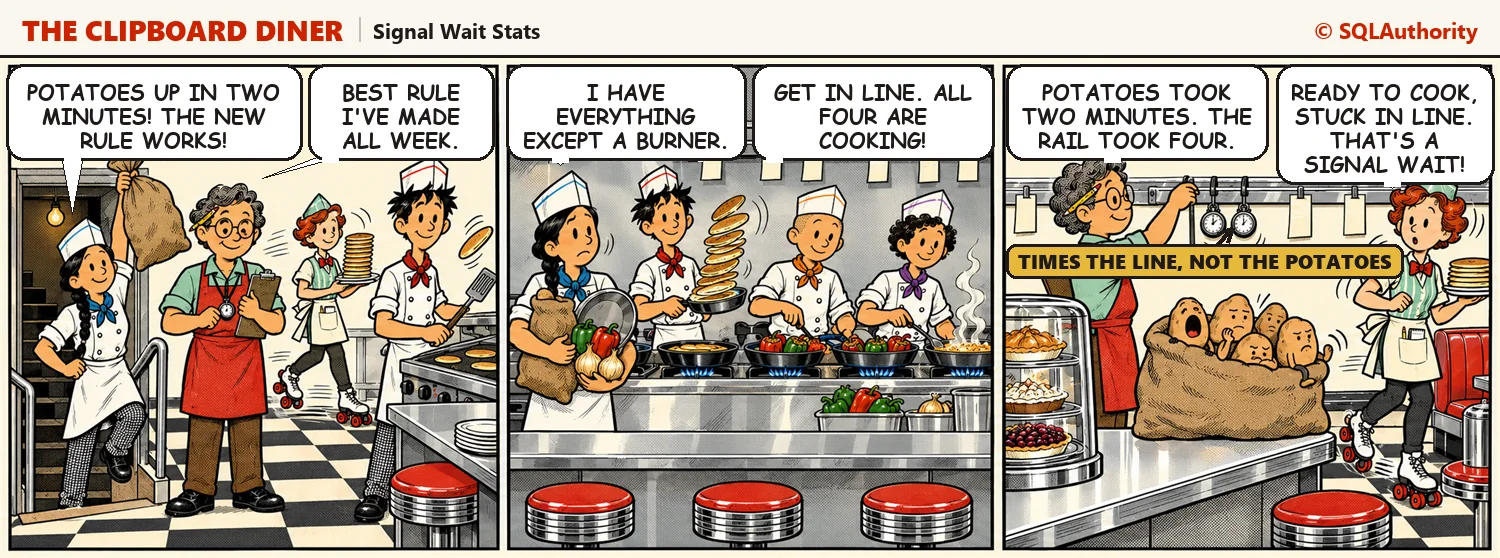
Signal wait stats show how long a SQL Server query sat ready to run, waiting in line for a CPU. On Night 2 at the Clipboard Diner, the potatoes arrive on time and the Garden Hash waits anyway. Then two queries split your server’s waits into the CPU part and the resource part.
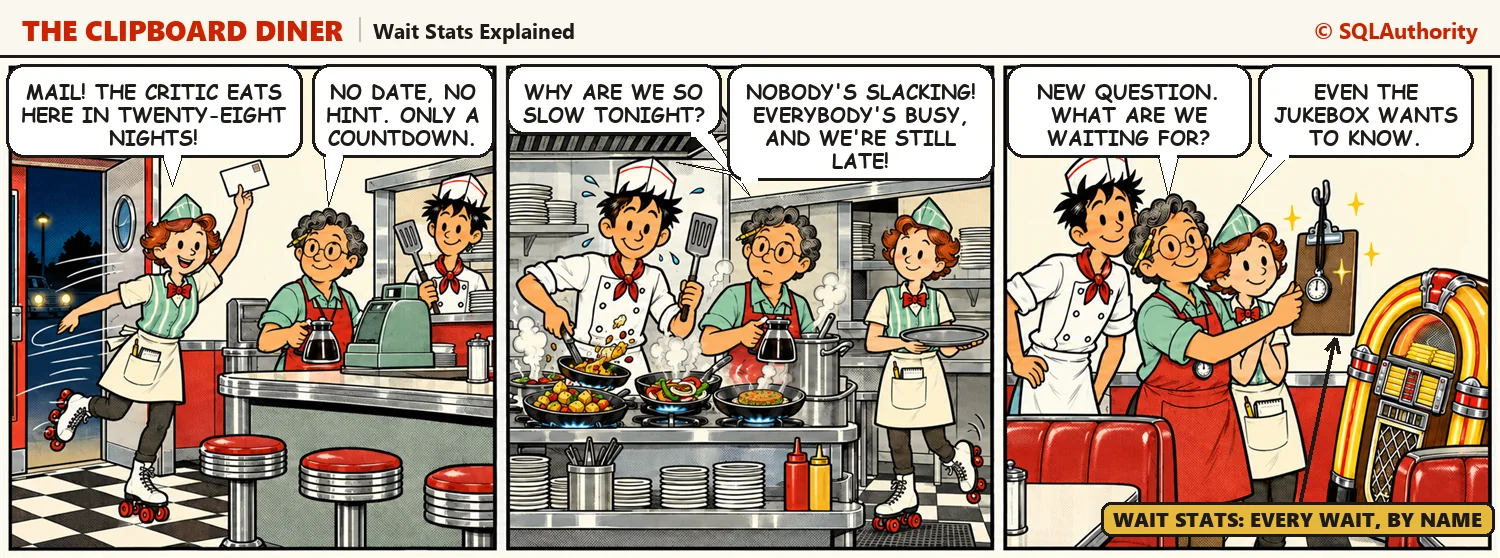
Wait Stats Explained: SQL Server as an All-Night Diner
Wait stats explained with one picture: SQL Server is an all-night diner, and every query is an order ticket that waits for something. Meet the Clipboard Diner, its owner Casey, the cooks and booth 7. Then count the burners and cooks on your own server with one query.
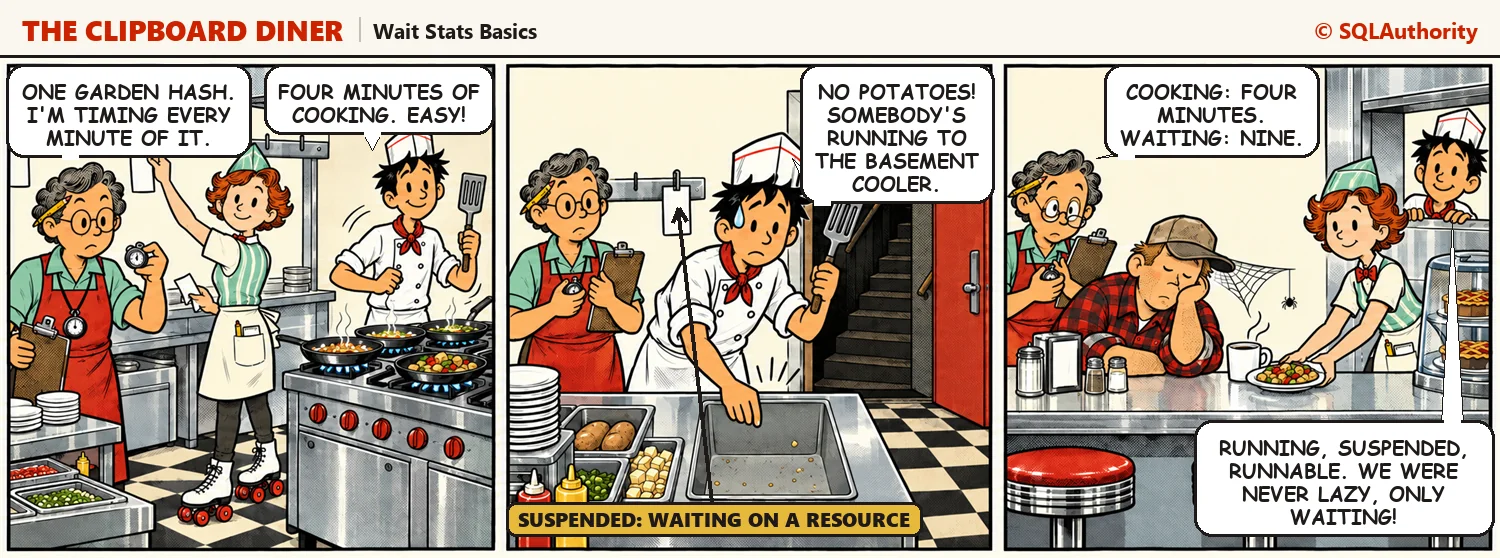
Wait Stats Basics: How Waits Work in SQL Server
Wait stats basics start with one idea: a query in SQL Server is always either working or waiting. On Night 1 at the Clipboard Diner, one plate of Garden Hash shows the three states every query moves through. Then two queries show the same thing on your own server.

High-Frequency Inserts Without Blocking
High-frequency inserts can stall on the log, indexes, or last-page contention; learn to diagnose the wait and choose targeted SQL Server fixes.

Measure CPU Pressure in SQL Server with Waits and Schedulers
CPU Pressure means tasks are ready to run but every scheduler is busy, so they wait in a queue. This post reads that queue from the schedulers, compares signal waits with resource waits, checks recent CPU history and finds the queries that use the most CPU. It ends with a plain way to decide between a faster CPU, more cores and better queries.

Five DMVs Worth Memorizing
Five DMVs worth memorizing show SQL Server sessions, active requests, waits, index use, and file I/O during an incident.

Comparing Two Wait Stats Snapshots to See What Changed
Compare wait stats snapshots over a chosen window, subtract cumulative counters, remove background waits, and calculate rates and average waits.