

Diagnose PAGEIOLATCH_SH waits by comparing file read latency with Query Store physical reads before blaming storage or changing indexes.

Finding the Slowest Stored Procedures With sys.dm_exec_procedure_stats
Find the slowest stored procedures with cache statistics, compare CPU and reads, and use two snapshots to isolate one busy hour.

OFFSET FETCH Paging and Its Deep Page Problem
Use OFFSET FETCH with a unique sort order, compare early and deep page reads, and decide when a cursor based approach fits better.

DMV Snapshot Deltas for a Query Activity Interval
DMV snapshot deltas show counter growth for cached statements that survive two observations. Compare their identities and report missing coverage before ranking activity.

Statistics Histograms Explained
Statistics histograms explained through steps, RANGE_ROWS, EQ_ROWS, and DBCC SHOW_STATISTICS help connect data shape to plan estimates.
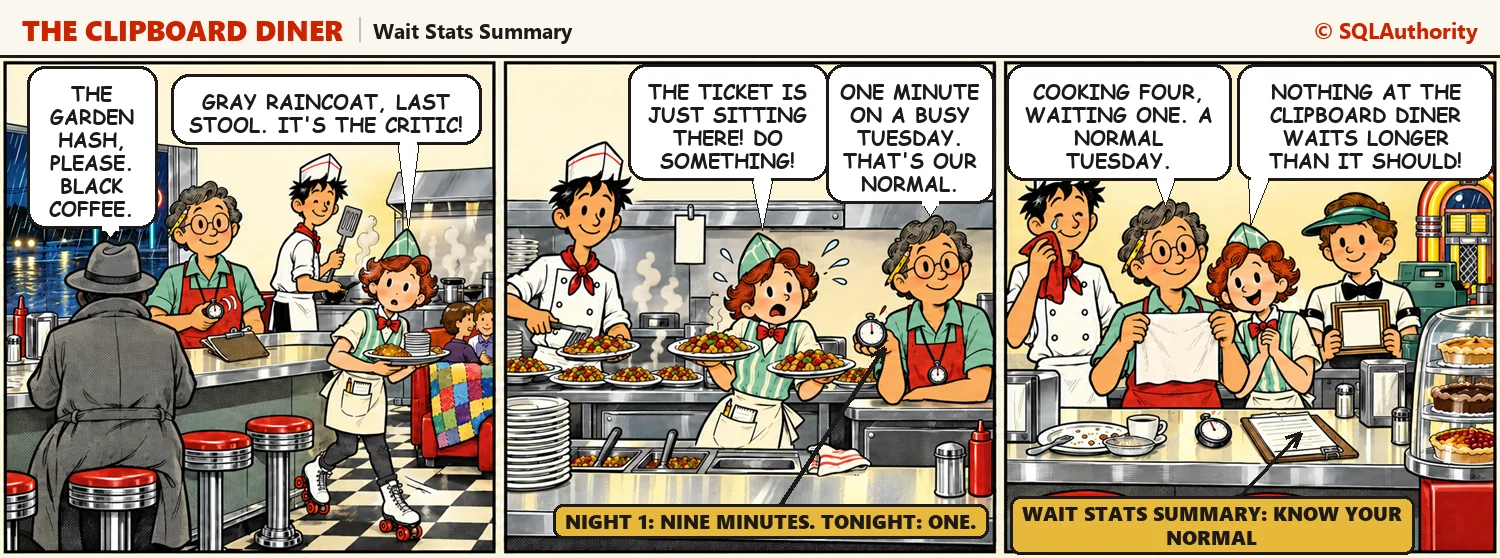
Wait Stats Summary: Every Wait on One Page
This wait stats summary puts every wait from the series on one page: what it means and the first fix to try. On Night 28 at the Clipboard Diner, the critic finally comes on an ordinary Tuesday. The lesson of the whole series is the same as the story’s: know what normal looks like on your server.
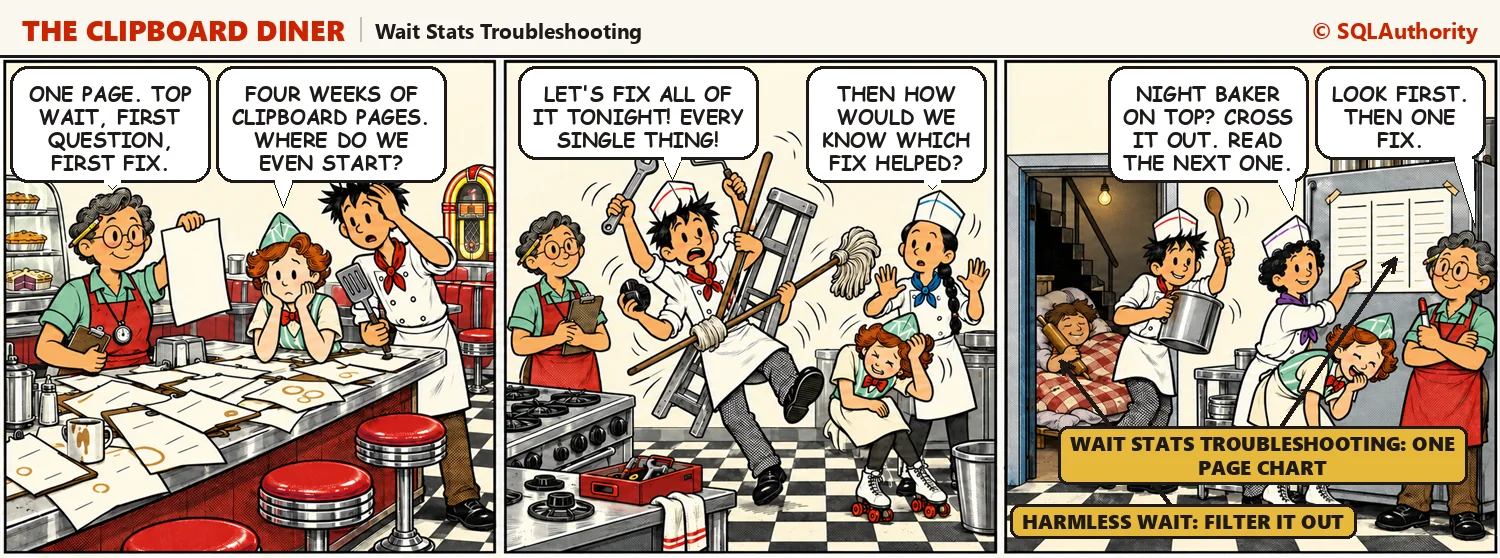
Wait Stats Troubleshooting: From Top Wait to First Fix
Wait stats troubleshooting comes down to one habit: find the top real wait, ask its first question, and try one fix. On Night 27 at the Clipboard Diner, Casey tapes a one-page chart to the fridge. Here is that chart for SQL Server, plus one query that shows your top waits with their share and signal percent.