A parallel plan can show threads with zero rows, and that is normal. SQL Server starts the workers, but the data never reaches some of them. This post reads the per-thread counters of two real plans on SQL Server 2025. It shows where the empty threads come from.

What a Parallel Plan Starts
A parallel plan splits one query across several worker threads. The degree of parallelism (DOP) is the number of workers. Parallelism operators, also called exchanges, move rows between the threads. Gather Streams sits at the top and collects everything for the client.
Three kinds of exchange exist. Distribute Streams sends rows from one thread to many. Repartition Streams moves rows between two sets of threads. Gather Streams brings many threads back to one. A hash repartition sends equal values to the same thread, and that detail matters later.
Each operator keeps a row counter for every thread. In SSMS you see it when you click an operator and open Properties. The line “Actual Number of Rows for All Executions” expands into one row per thread. Thread 0 is the coordinator. The workers are thread 1 and up.
Build the Test
I ran everything here on SQL Server 2025. The script makes a table of 2,000,000 visits and a second table of 3,000 visits. Both have only three regions, which matters later. It also switches on LAST_QUERY_PLAN_STATS for this database. That setting keeps the last actual plan of each query, so a query can read it back. It changes only this database and disappears with it.
IF DB_ID(N'SqlParallelThreadsDemo') IS NULL CREATE DATABASE SqlParallelThreadsDemo;
GO
USE SqlParallelThreadsDemo;
GO
ALTER DATABASE SCOPED CONFIGURATION SET LAST_QUERY_PLAN_STATS = ON;
GO
DROP TABLE IF EXISTS dbo.Visits, dbo.SmallVisits;
CREATE TABLE dbo.Visits (VisitID int NOT NULL PRIMARY KEY, Region tinyint NOT NULL, Pages int NOT NULL);
INSERT INTO dbo.Visits (VisitID, Region, Pages)
SELECT s.value, s.value % 3 + 1, s.value % 40
FROM GENERATE_SERIES(1, 2000000) AS s;
SELECT TOP (3000) VisitID, Region, Pages INTO dbo.SmallVisits FROM dbo.Visits ORDER BY VisitID;
GO
Now the two queries. Each counts visits per region. The comment at the top is a tag, so the next script can find each plan. The hints ask for up to eight workers and tell the optimizer to prefer a parallel plan. Without the second hint, my instance chose a serial plan for the big table.
/* big table */
SELECT Region, COUNT(*) AS Visits FROM dbo.Visits GROUP BY Region OPTION (MAXDOP 8, USE HINT('ENABLE_PARALLEL_PLAN_PREFERENCE'));
GO
/* small table */
SELECT Region, COUNT(*) AS Visits FROM dbo.SmallVisits GROUP BY Region OPTION (MAXDOP 8, USE HINT('ENABLE_PARALLEL_PLAN_PREFERENCE'));
GO
Read the Counters
The next query shreds the saved plans. For every operator it counts the worker threads and the threads that returned zero rows. It also reports the smallest and largest row counts. It skips thread 0, so only workers appear.
WITH XMLNAMESPACES (DEFAULT 'http://schemas.microsoft.com/sqlserver/2004/07/showplan'),
Counters AS
(
    SELECT CASE WHEN st.text LIKE N'%/* big table */%' THEN N'big' ELSE N'small' END AS Query,
           n.value('@NodeId', 'int') AS NodeId, n.value('@PhysicalOp', 'varchar(40)') AS Operator,
           t.value('@Thread', 'int') AS Thread, t.value('@ActualRows', 'bigint') AS ActualRows
    FROM sys.dm_exec_query_stats AS qs
    CROSS APPLY sys.dm_exec_sql_text(qs.sql_handle) AS st
    CROSS APPLY sys.dm_exec_query_plan_stats(qs.plan_handle) AS p
    CROSS APPLY p.query_plan.nodes('//RelOp') AS a(n)
    CROSS APPLY a.n.nodes('RunTimeInformation/RunTimeCountersPerThread') AS b(t)
    WHERE (st.text LIKE N'%/* big table */%' OR st.text LIKE N'%/* small table */%') AND st.text NOT LIKE N'%dm_exec_query_stats%'
)
SELECT Query, NodeId, Operator, COUNT(*) AS Threads, SUM(CASE WHEN ActualRows = 0 THEN 1 ELSE 0 END) AS ZeroRows,
       MIN(ActualRows) AS MinRows, MAX(ActualRows) AS MaxRows, SUM(ActualRows) AS TotalRows
FROM Counters
WHERE Thread > 0
GROUP BY Query, NodeId, Operator
ORDER BY Query, NodeId;
GO
Threads with zero rows show up in the ZeroRows column. Read three columns first. ZeroRows counts the workers that started and ended without a single row. MinRows and MaxRows show the spread. A scan with both numbers close together is balanced.
| Query | NodeId | Operator | Threads | ZeroRows | MinRows | MaxRows | TotalRows |
|---|---|---|---|---|---|---|---|
| big | 1 | Compute Scalar | 8 | 6 | 0 | 2 | 3 |
| big | 2 | Hash Match | 8 | 6 | 0 | 2 | 3 |
| big | 3 | Clustered Index Scan | 8 | 0 | 241,562 | 309,065 | 2,000,000 |
| small | 3 | Stream Aggregate | 8 | 6 | 0 | 2 | 3 |
| small | 4 | Parallelism | 8 | 6 | 0 | 14 | 21 |
| small | 5 | Stream Aggregate | 8 | 1 | 0 | 3 | 21 |
| small | 6 | Sort | 8 | 1 | 0 | 449 | 3,000 |
| small | 7 | Table Scan | 8 | 1 | 0 | 449 | 3,000 |
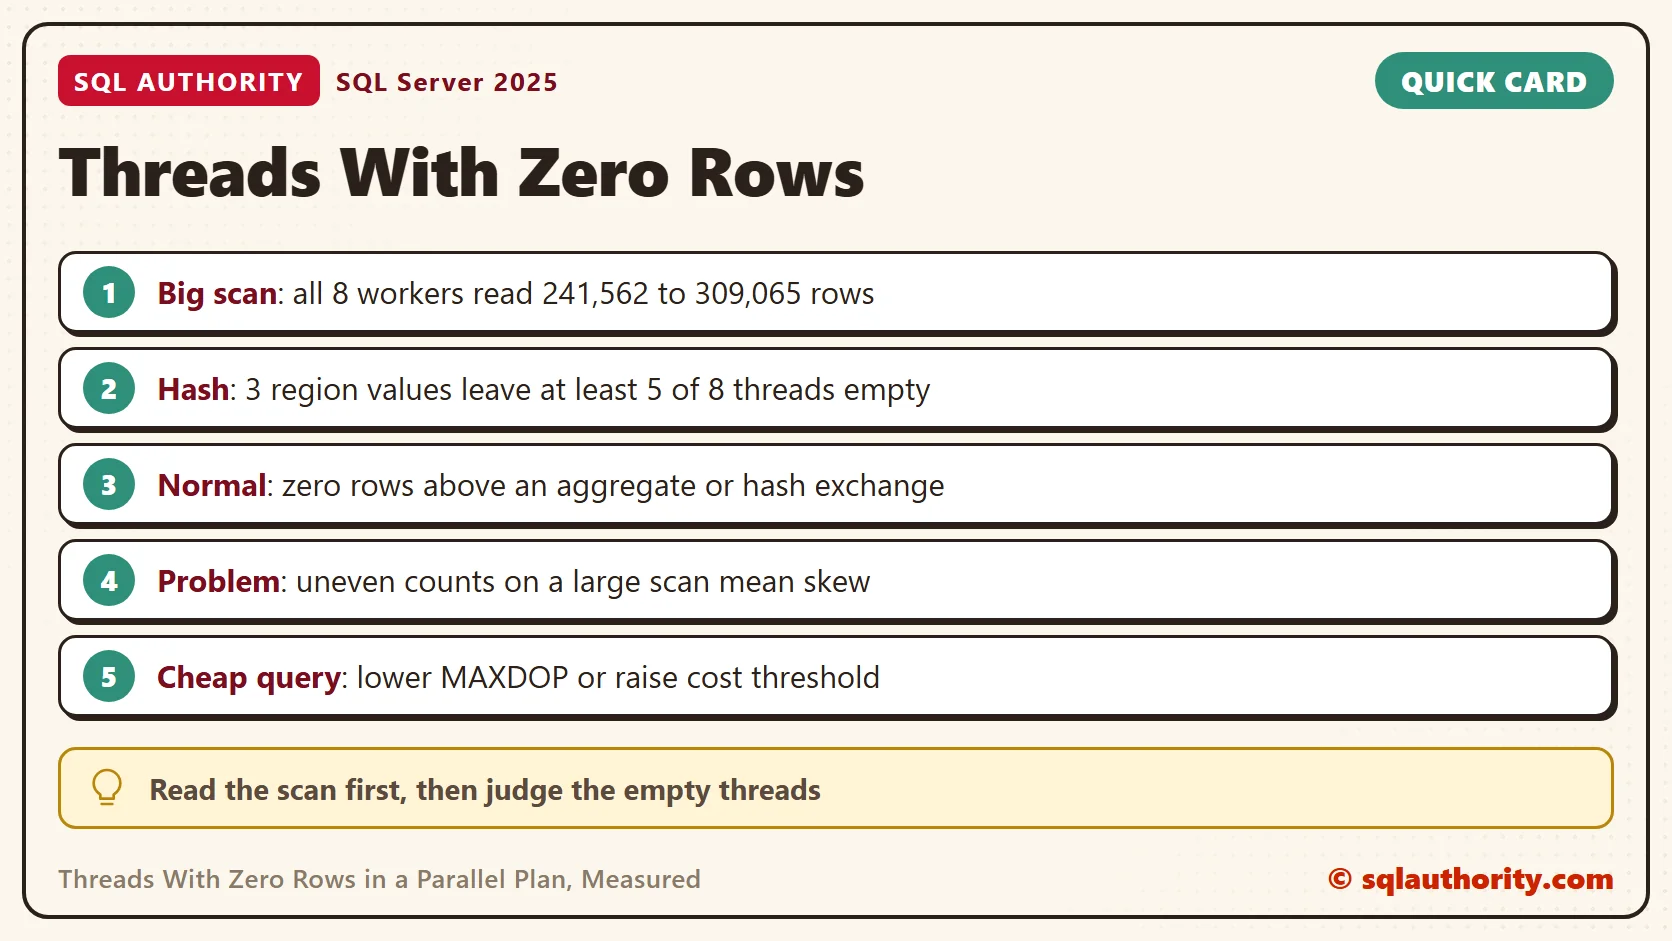
Start with the big table. The scan at the bottom gave rows to all eight workers. The counts ran from 241,562 to 309,065 and add up to the full 2,000,000. No worker sat idle where the data lives. The next query lists the eight counters of that scan.
WITH XMLNAMESPACES (DEFAULT 'http://schemas.microsoft.com/sqlserver/2004/07/showplan')
SELECT t.value('@Thread', 'int') AS Thread, t.value('@ActualRows', 'bigint') AS ActualRows
FROM sys.dm_exec_query_stats AS qs
CROSS APPLY sys.dm_exec_sql_text(qs.sql_handle) AS st
CROSS APPLY sys.dm_exec_query_plan_stats(qs.plan_handle) AS p
CROSS APPLY p.query_plan.nodes('//RelOp[@PhysicalOp="Clustered Index Scan"]/RunTimeInformation/RunTimeCountersPerThread') AS b(t)
WHERE st.text LIKE N'%/* big table */%' AND st.text NOT LIKE N'%dm_exec_query_stats%'
ORDER BY Thread;
GO| Thread | ActualRows |
|---|---|
| 1 | 241,562 |
| 2 | 241,562 |
| 3 | 241,563 |
| 4 | 241,562 |
| 5 | 241,562 |
| 6 | 241,562 |
| 7 | 241,562 |
| 8 | 309,065 |
The picture changes above the scan. The Hash Match produced the three result rows, one per region. Six of the eight workers returned nothing. Three rows cannot keep eight threads busy, so empty threads are expected here.
Why the Small Table Differs
The small table shows two more causes. The first is the scan. Its 3,000 rows fit on a few pages, and a parallel scan hands pages to threads as they ask. A thread that asks late can find none left. One worker got no rows, and the busiest read 449.
The second is the Parallelism operator after the local aggregate. It sends each region to one thread by hashing the Region value. Three distinct values over eight threads leave at least five threads empty. Here six were empty, because two threads received all 21 rows.
Run It Again
The counts change from run to run, so I ran the pair five times. Threads with zero rows appeared above the scan in every run. The big scan never had an empty worker. Its busiest thread read between 309,065 and 429,846 rows. The Hash Match had five to seven empty workers. The small scan had one or two. The exchange had six every time, because the hash of three values does not change.
When an Empty Thread Is a Problem
You could say every idle worker is waste. Fair point, with a limit. Each parallel branch reserves one worker thread per degree of parallelism, whether rows arrive or not. Eight reservations to count 3,000 rows is a poor trade. For a query like that, lower MAXDOP or raise the cost threshold for parallelism so cheap queries stay serial.
Zero rows above an aggregate or after a hash exchange on few values needs no fix. Uneven counts on the scan are different. When one thread reads far more rows than its peers, the query waits for the slowest thread. That points to skewed data, and it is worth a look.
The hash exchange shows why. Equal values always land on the same thread. Suppose one region held 90 percent of the rows. One thread would then carry 90 percent of the work after the exchange. The empty threads would be a symptom of the skew, not its cause.
A Simple Rule
Read the scan first. Threads with zero rows above a balanced scan are normal. A scan is balanced when every thread has rows and the counts are close. If the scan counts differ a lot on a large table, the work is skewed. SQL Server 2022 and later can lower the degree of parallelism of a repeating query by itself. The feature is called DOP feedback.
The actual plan also records elapsed time per thread. Compare rows with time before you decide that a thread was idle or only fast.
When you finish testing, remove the example database.
USE master;
GO
ALTER DATABASE SqlParallelThreadsDemo SET SINGLE_USER WITH ROLLBACK IMMEDIATE;
DROP DATABASE SqlParallelThreadsDemo;
A thread with zero rows is not a bug, it is a thread that had nothing to carry.
Published by Pinal Dave on SQLAuthority. More of my work at pinaldave.com.
Discover more from SQL Authority with Pinal Dave
Subscribe to get the latest posts sent to your email.