
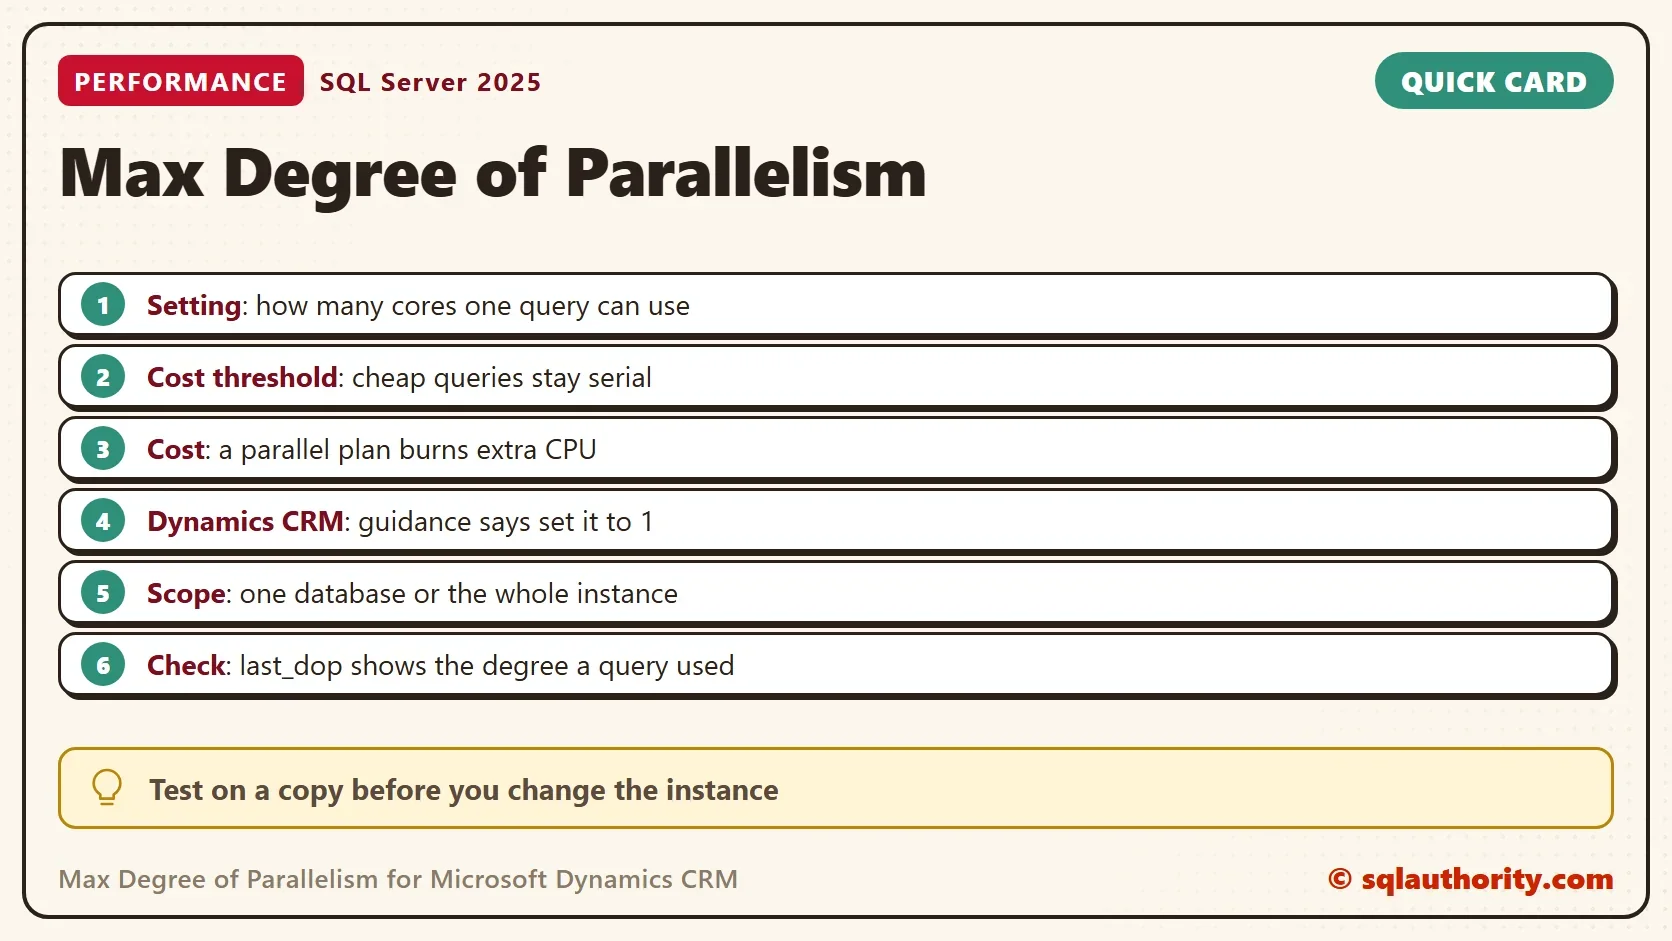
Max degree of parallelism decides how many CPU cores one query can use. The vendor guidance for Microsoft Dynamics CRM has been to set it to 1. Check the current guidance for your version before you change anything. Below you see what parallelism costs and how to limit it safely.

What Parallelism Does
A parallel plan splits one query across several cores. The cores work at the same time, so a big query finishes sooner. The split has a price. SQL Server must start the workers, hand out the rows and gather the results. For a big query that price is small. For a tiny query it can be larger than the work itself.
Two settings control the behavior. The max degree of parallelism sets the highest number of cores one query can use. The cost threshold for parallelism sets how expensive a query must look before SQL Server even considers a parallel plan. A value of 0 for the first setting lets SQL Server use all processors, up to 64. The second setting starts at 5.
Why Dynamics CRM Is Different
A CRM application sends a steady stream of short queries, one for each page, grid and form. Few of them are big enough to gain from extra cores. When every short query grabs several cores, the cores run out for the queries behind it. The reported symptoms are slow pages and white screens, even on a well tuned server. For Dynamics 365 on-premises (version 9), read the current vendor guidance for your build.
For that reason, the vendor guidance for Dynamics CRM databases has been a max degree of parallelism of 1. Other products differ. Dynamics AX, for example, runs large reports. A limit above 1 and a higher cost threshold can suit it.
Look at Your Settings
The first query reads both settings. The test server uses a cost threshold of 50 and a limit of 2.
SELECT name, value_in_use
FROM sys.configurations
WHERE name IN (N'max degree of parallelism', N'cost threshold for parallelism')
ORDER BY name;
| name | value_in_use |
|---|---|
| cost threshold for parallelism | 50 |
| max degree of parallelism | 2 |
See What Parallelism Costs
The next script creates ParallelCrmDemo with an Activities table of 1.5 million rows and a small Accounts table. Both experiments below use it.
IF DB_ID(N'ParallelCrmDemo') IS NULL CREATE DATABASE ParallelCrmDemo;
GO
USE ParallelCrmDemo;
GO
DROP TABLE IF EXISTS dbo.Activities, dbo.Accounts;
CREATE TABLE dbo.Activities (
    ActivityID int NOT NULL PRIMARY KEY,
    AccountID  int NOT NULL,
    Points     int NOT NULL,
    Note       char(100) NOT NULL DEFAULT 'n'
);
CREATE TABLE dbo.Accounts (AccountID int NOT NULL PRIMARY KEY, Region int NOT NULL);
INSERT INTO dbo.Activities (ActivityID, AccountID, Points)
SELECT TOP (1500000) ROW_NUMBER() OVER (ORDER BY (SELECT NULL)),
       ABS(CHECKSUM(NEWID())) % 20000, ABS(CHECKSUM(NEWID())) % 100
FROM sys.all_objects AS a CROSS JOIN sys.all_objects AS b CROSS JOIN sys.all_objects AS c;
INSERT INTO dbo.Accounts (AccountID, Region)
SELECT TOP (20000) ROW_NUMBER() OVER (ORDER BY (SELECT NULL)) - 1, ABS(CHECKSUM(NEWID())) % 50
FROM sys.all_objects AS a CROSS JOIN sys.all_objects AS b;
CREATE INDEX IX_Activities_Account ON dbo.Activities (AccountID) INCLUDE (Points);
The first experiment runs one heavy query three times. It ranks the activities inside each account. The first run uses the server default. The second forces a single core. The third allows eight. A comment in each statement lets the next query find its own row.
SELECT COUNT(*) AS Firsts
FROM (SELECT ROW_NUMBER() OVER (PARTITION BY AccountID ORDER BY Points DESC, ActivityID) AS rn
      FROM dbo.Activities) AS r
WHERE rn = 1 /*run-default*/;
GO
SELECT COUNT(*) AS Firsts
FROM (SELECT ROW_NUMBER() OVER (PARTITION BY AccountID ORDER BY Points DESC, ActivityID) AS rn
      FROM dbo.Activities) AS r
WHERE rn = 1 OPTION (MAXDOP 1) /*run-serial*/;
GO
SELECT COUNT(*) AS Firsts
FROM (SELECT ROW_NUMBER() OVER (PARTITION BY AccountID ORDER BY Points DESC, ActivityID) AS rn
      FROM dbo.Activities) AS r
WHERE rn = 1 OPTION (MAXDOP 8) /*run-eight*/;
SELECT CASE WHEN t.text LIKE N'%/*run-default*/%' THEN N'server default'
WHEN t.text LIKE N'%/*run-serial*/%' THEN N'MAXDOP 1'
ELSE N'MAXDOP 8' END AS Run,
s.last_dop AS Dop,
s.last_worker_time / 1000 AS CpuMs,
s.last_elapsed_time / 1000 AS ElapsedMs
FROM sys.dm_exec_query_stats AS s
CROSS APPLY sys.dm_exec_sql_text(s.sql_handle) AS t
WHERE t.text LIKE N'%/*run-%' AND t.text NOT LIKE N'%dm_exec_query_stats%'
ORDER BY CASE WHEN t.text LIKE N'%/*run-default*/%' THEN 1 WHEN t.text LIKE N'%/*run-serial*/%' THEN 2 ELSE 3 END;| Run | Dop | CpuMs | ElapsedMs |
|---|---|---|---|
| server default | 2 | 446 | 226 |
| MAXDOP 1 | 1 | 354 | 354 |
| MAXDOP 8 | 8 | 563 | 83 |
This is one run, so your numbers will differ. More cores finish the heavy query sooner. The CPU time rises, because the workers add overhead. Parallelism still suits this query.
The second experiment looks like a CRM page. It is a small query that finds a few hundred rows. The test server has a cost threshold of 50, so the optimizer keeps a query this small serial. The hint in the second procedure forces a parallel plan, to show what a low cost threshold would do. The hint needs SQL Server 2016 SP1 or later. Each procedure runs 300 times.
CREATE OR ALTER PROCEDURE dbo.LookupSerial AS
    SELECT COUNT(*) AS Matches
    FROM dbo.Accounts AS a JOIN dbo.Activities AS v ON v.AccountID = a.AccountID
    WHERE a.Region = 7 AND a.AccountID < 400
    OPTION (MAXDOP 1);
GO
CREATE OR ALTER PROCEDURE dbo.LookupParallel AS
    SELECT COUNT(*) AS Matches
    FROM dbo.Accounts AS a JOIN dbo.Activities AS v ON v.AccountID = a.AccountID
    WHERE a.Region = 7 AND a.AccountID < 400
    OPTION (MAXDOP 8, USE HINT ('ENABLE_PARALLEL_PLAN_PREFERENCE'));
GO
SET NOCOUNT ON;
DROP TABLE IF EXISTS #sink;
CREATE TABLE #sink (Matches int);
DECLARE @i int = 0;
WHILE @i < 300
BEGIN
    INSERT INTO #sink EXEC dbo.LookupSerial;
    INSERT INTO #sink EXEC dbo.LookupParallel;
    SET @i += 1;
END;
SELECT OBJECT_NAME(object_id) AS ProcName, execution_count AS Runs,
       total_worker_time / 1000 AS CpuMs, total_elapsed_time / 1000 AS ElapsedMs
FROM sys.dm_exec_procedure_stats
WHERE database_id = DB_ID()
ORDER BY ProcName;| ProcName | Runs | CpuMs | ElapsedMs |
|---|---|---|---|
| LookupParallel | 300 | 1772 | 816 |
| LookupSerial | 300 | 1036 | 1036 |
The parallel version used more CPU for the same 300 answers. It was 71 percent more in this run, and between 24 and 71 percent in others. Its elapsed time was not reliably better. Both tables come from one run, so your numbers will differ. On a quiet server, nobody notices. On a busy CRM server with hundreds of users, CPU is the shared resource. That extra cost lands on everybody.
Limit It Without Changing the Instance
The instance setting affects every database on the server. A database scoped setting affects only one database, and it needs SQL Server 2016 or later. It suits a server that hosts CRM next to a reporting database. The script sets the limit to 1 and runs the heavy query without a hint. It then sets the value back to 0.
ALTER DATABASE SCOPED CONFIGURATION SET MAXDOP = 1;
GO
SELECT COUNT(*) AS Firsts
FROM (SELECT ROW_NUMBER() OVER (PARTITION BY AccountID ORDER BY Points DESC, ActivityID) AS rn
      FROM dbo.Activities) AS r
WHERE rn = 1 /*run-scoped*/;
GO
SELECT s.last_dop AS Dop, s.last_worker_time / 1000 AS CpuMs, s.last_elapsed_time / 1000 AS ElapsedMs
FROM sys.dm_exec_query_stats AS s
CROSS APPLY sys.dm_exec_sql_text(s.sql_handle) AS t
WHERE t.text LIKE N'%/*run-scoped*/%' AND t.text NOT LIKE N'%dm_exec_query_stats%';
GO
ALTER DATABASE SCOPED CONFIGURATION SET MAXDOP = 0;| Dop | CpuMs | ElapsedMs |
|---|---|---|
| 1 | 333 | 333 |
The query used one core because the database said so. For the whole instance, turn on the advanced options, set the value, and apply it. These three statements are the standard sequence. They change the whole server, so run them only after a test on a copy.
EXEC sys.sp_configure N'show advanced options', 1; RECONFIGURE;EXEC sys.sp_configure N'max degree of parallelism', 1; RECONFIGURE;EXEC sys.sp_configure N'show advanced options', 0; RECONFIGURE;
You could argue that a limit of 1 is too blunt. Month-end jobs and reports on the same instance gain from parallelism, as the heavy query showed. That’s right. A softer option keeps the limit above 1 and raises the cost threshold, so only expensive queries go parallel. The CRM guidance is a starting point, and your own measurements decide.
What to Remember
Parallelism trades extra CPU for shorter waits. A workload of many short queries gains little from it and pays for it on every call. Read the settings, measure last_dop and CPU for your own queries, and change one thing at a time.
When you finish with the demo, run the cleanup script. The scoped setting was already set back to 0 above.
USE master;
GO
IF DB_ID(N'ParallelCrmDemo') IS NOT NULL
BEGIN
    ALTER DATABASE ParallelCrmDemo SET SINGLE_USER WITH ROLLBACK IMMEDIATE;
    DROP DATABASE ParallelCrmDemo;
END;
Parallelism is not speed, it is a trade of extra CPU for shorter waits.
Published by Pinal Dave on SQLAuthority. More of my work at pinaldave.com.
Discover more from SQL Authority with Pinal Dave
Subscribe to get the latest posts sent to your email.



5 Comments. Leave new
Thanks , great article as always.
I experienced the same issue on our OLTP system which is all in house built. Users where complaining daily of slow performance , I noticed a lot of latches , CXPACKET was top of the list of wait types, did not want to just change maxdop so quickly so i investigated further and found that SQL server was doing parallel processing for many small transactions which I thought did not need all cpu’s, there where also key lookups in the execution plan which i fixed, I then decided to change maxdop to 4 and cost threshold to 50, this actually solved the performance issues.
I think this solution not only works for CRM but can work on OLTP systems as well with further investigation. Since 2016 CU3 there is a new waittype called CXConsumer , this will be immediately after CXPacket , this tells you that the parallelism is a genuine and can be safely ignored.There is a lot more to CXPacket and CXConsumer , people reading this can read up on it for further investigating there issue
Thanks for sharing. The maxdop value really depends on application.
For Dynamics AX, Microsoft still recommends MAXDOP 1, even though AX makes a lot of very expensive queries for reporting and for example, periodical calculations like VAT calculations or trial balance.
I have had very good results in every AX installation using MAXDOP 4 to 8, depending on processor cores and NUMA.
The essential key here is to adjust “Cost threshold for parallelism” to something much higher that the default 5.
Depending on your environment, AX features in use etc. I strongly suggest to try setting MAXDOP > 1 and experiment “Cost threshold for parallelism” values between 25-50.
I have also made same changes to a few CRM installations and results have also been good.
Thanks for sharing your thoughts Vesa.
Thanks Pinal Dave. Would you assume a recommended MaxDOP setting of 1 still for Dynamics v9 on-prem with SQL 2016? We have run into significant performance issues when user load exceeds 1000