DMV snapshot deltas measure counter growth between two observations of cached query statements. A lifetime CPU total cannot answer an interval question. Compare surviving statement identities and report what the cache comparison cannot cover.

Keep statement identity beside the counters
sys.dm_exec_query_stats records totals for statements in cached plans. Its rows disappear when those plans leave the cache. The counters reflect completed executions, so they do not describe every query currently running.
Match plan_handle, sql_handle, both statement offsets, creation_time and plan_generation_num. The generation distinguishes recompiled instances. A shared query_hash alone does not establish a comparable counter lifetime.
This example targets ordinary cached statements on SQL Server 2016 or later. Run the three blocks in order in one connection, because the later blocks use the temporary tables created by the first two. Natively compiled procedure counters need separate interpretation; this is not a universal workload collector.
Capture twice without resetting the cache
The collector reads server DMVs and writes only its temporary tables. It does not clear caches, recompile queries or change server settings.
-- SQL Server rowstore cached statements. Read-only server DMVs.
-- Writes only local temporary tables, then drops those exact tables.
-- Five-second demonstration, not a benchmark or full workload history.
SET NOCOUNT ON;
DROP TABLE IF EXISTS #QueryComparison;
DROP TABLE IF EXISTS #QuerySnapshot2;
DROP TABLE IF EXISTS #QuerySnapshot1;
DROP TABLE IF EXISTS #CaptureBounds;
CREATE TABLE #CaptureBounds(Capture1StartUtc datetime2(7),Capture1EndUtc datetime2(7),
       Capture2StartUtc datetime2(7),Capture2EndUtc datetime2(7));
INSERT #CaptureBounds(Capture1StartUtc) VALUES(SYSUTCDATETIME());
SELECT plan_handle,sql_handle,statement_start_offset,statement_end_offset,
       creation_time,plan_generation_num,query_hash,
       execution_count,total_worker_time,total_logical_reads
INTO #QuerySnapshot1
FROM sys.dm_exec_query_stats;
UPDATE #CaptureBounds SET Capture1EndUtc=SYSUTCDATETIME();
For a short demonstration, wait five seconds between captures. For an investigation, choose a gap that covers the workload of interest. Record each collection’s start and end, because a DMV scan is not an instantaneous snapshot.
WAITFOR DELAY '00:00:05';
UPDATE #CaptureBounds SET Capture2StartUtc=SYSUTCDATETIME();
SELECT plan_handle,sql_handle,statement_start_offset,statement_end_offset,
       creation_time,plan_generation_num,query_hash,
       execution_count,total_worker_time,total_logical_reads
INTO #QuerySnapshot2
FROM sys.dm_exec_query_stats;
UPDATE #CaptureBounds SET Capture2EndUtc=SYSUTCDATETIME();
Report unmatched rows before ranking activity
Use a full join to expose identities present in only one capture. Label those rows FIRST_ONLY or SECOND_ONLY. Neither label, by itself, proves when a plan disappeared or why it appeared.
Keep matching rows with decreasing counters out of the activity ranking. The example labels them COUNTER_DECREASE. Only MATCHED rows with positive execution growth enter its ranking.
WITH Compared AS
(
    SELECT COALESCE(b.query_hash,a.query_hash) AS query_hash,
           COALESCE(b.plan_handle,a.plan_handle) AS plan_handle,
           COALESCE(b.sql_handle,a.sql_handle) AS sql_handle,
           COALESCE(b.statement_start_offset,a.statement_start_offset)
               AS statement_start_offset,
           COALESCE(b.statement_end_offset,a.statement_end_offset)
               AS statement_end_offset,
           COALESCE(b.creation_time,a.creation_time) AS creation_time,
           COALESCE(b.plan_generation_num,a.plan_generation_num)
               AS plan_generation_num,
           CASE WHEN a.plan_handle IS NULL THEN 'SECOND_ONLY'
                WHEN b.plan_handle IS NULL THEN 'FIRST_ONLY'
                WHEN b.execution_count<a.execution_count
                  OR b.total_worker_time<a.total_worker_time
                  OR b.total_logical_reads<a.total_logical_reads
                    THEN 'COUNTER_DECREASE'
                ELSE 'MATCHED' END AS Coverage,
           b.execution_count-a.execution_count AS Executions,
           b.total_worker_time-a.total_worker_time AS WorkerMicroseconds,
           b.total_logical_reads-a.total_logical_reads AS LogicalReads
    FROM #QuerySnapshot1 AS a
    FULL JOIN #QuerySnapshot2 AS b
      ON b.plan_handle=a.plan_handle AND b.sql_handle=a.sql_handle
     AND b.statement_start_offset=a.statement_start_offset
     AND b.statement_end_offset=a.statement_end_offset
     AND b.creation_time=a.creation_time
     AND b.plan_generation_num=a.plan_generation_num
)
SELECT * INTO #QueryComparison FROM Compared;

SELECT Capture1StartUtc,Capture1EndUtc,Capture2StartUtc,Capture2EndUtc,
       DATEDIFF_BIG(millisecond,Capture1EndUtc,Capture2StartUtc) AS GapMilliseconds
FROM #CaptureBounds;
SELECT Coverage,COUNT_BIG(*) AS StatementRows
FROM #QueryComparison GROUP BY Coverage ORDER BY Coverage;

SELECT TOP (10) query_hash,Executions AS IntervalExecutions,
       WorkerMicroseconds AS IntervalWorkerMicroseconds,
       LogicalReads AS IntervalLogicalReads,
       statement_start_offset,statement_end_offset,plan_generation_num
FROM #QueryComparison
WHERE Coverage='MATCHED' AND Executions>0
ORDER BY WorkerMicroseconds DESC,LogicalReads DESC,query_hash;

IF EXISTS
(
    SELECT 1 FROM #QueryComparison WHERE Coverage='MATCHED'
    AND (Executions<0 OR WorkerMicroseconds<0 OR LogicalReads<0)
)
    THROW 51003,'A decreasing counter entered the matched population.',1;

SELECT 'Completed, no persistent objects or server settings changed' AS CollectorStatus;
DROP TABLE #QueryComparison;
DROP TABLE #QuerySnapshot2;
DROP TABLE #QuerySnapshot1;
DROP TABLE #CaptureBounds;
The output stays at statement level and preserves offsets and plan generation. Before cleanup, the temporary comparison also carries the handles. The three blocks together give you the capture bounds, the coverage summary and the ranking. They drop their temporary tables after reporting. Remove the last few DROP lines only when you need to investigate the underlying identities.

Read an empty ranking honestly
A successful empty ranking means the matched population had no observed positive execution delta. It does not prove that the whole server was idle. Unmatched plans, unfinished work and collection gaps remain possible.
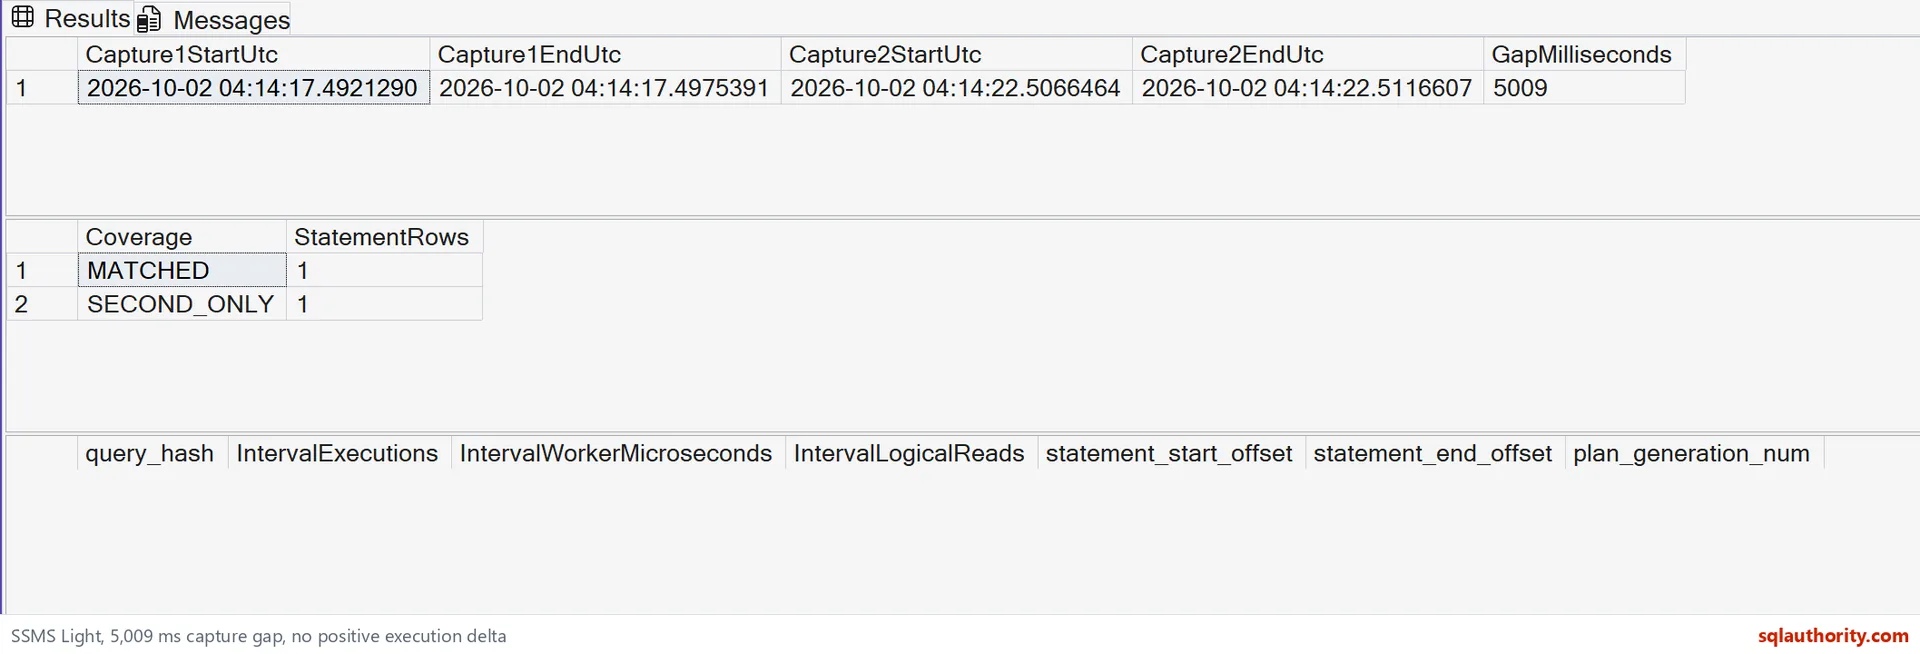
My October 2, 2026 sample produced an empty activity ranking. Both captures succeeded; their coverage summary shows which statements could be compared. This is an observation from a short sample, not a performance benchmark.
A small set of made-up sample rows makes the subtraction easy to inspect. It changes one surviving statement from 10 executions to 13, giving a delta of 3. Worker time increases by 900 microseconds, and logical reads increase by 45.
Those numbers are sample inputs, not measured server activity. The sample also includes a statement with no activity, missing identities, a new generation and decreasing counters. Only the comparable active row reaches the ranking. This tests the comparison without forcing any server cache changes.
SET NOCOUNT ON;
DROP TABLE IF EXISTS #QueryComparison;
DROP TABLE IF EXISTS #QuerySnapshot2;
DROP TABLE IF EXISTS #QuerySnapshot1;
CREATE TABLE #QuerySnapshot1
(
    plan_handle varbinary(64),sql_handle varbinary(64),
    statement_start_offset int,statement_end_offset int,
    creation_time datetime,plan_generation_num bigint,query_hash binary(8),
    execution_count bigint,total_worker_time bigint,total_logical_reads bigint
);
SELECT * INTO #QuerySnapshot2 FROM #QuerySnapshot1;
-- 0x01: successful interval subtraction; 0x02: no completed activity.
-- 0x03: first-only; 0x04: counter decrease; 0x05: recompiled generation.
INSERT #QuerySnapshot1 VALUES
(0x01,0x01,0,20,'20261002',1,0x0000000000000001,10,1000,100),
(0x02,0x02,0,20,'20261002',1,0x0000000000000002,10,1000,100),
(0x03,0x03,0,20,'20261002',1,0x0000000000000003,10,1000,100),
(0x04,0x04,0,20,'20261002',1,0x0000000000000004,10,1000,100),
(0x05,0x05,0,20,'20261002',1,0x0000000000000005,10,1000,100);
INSERT #QuerySnapshot2 VALUES
(0x01,0x01,0,20,'20261002',1,0x0000000000000001,13,1900,145),
(0x02,0x02,0,20,'20261002',1,0x0000000000000002,10,1000,100),
(0x04,0x04,0,20,'20261002',1,0x0000000000000004,1,100,10),
(0x05,0x05,0,20,'20261002',2,0x0000000000000005,1,100,10),
(0x06,0x06,0,20,'20261002',1,0x0000000000000006,7,700,70);

WITH Compared AS
(
    SELECT COALESCE(b.query_hash,a.query_hash) AS query_hash,
           CASE WHEN a.plan_handle IS NULL THEN 'SECOND_ONLY'
                WHEN b.plan_handle IS NULL THEN 'FIRST_ONLY'
                WHEN b.execution_count<a.execution_count
                  OR b.total_worker_time<a.total_worker_time
                  OR b.total_logical_reads<a.total_logical_reads
                    THEN 'COUNTER_DECREASE'
                ELSE 'MATCHED' END AS Coverage,
           b.execution_count-a.execution_count AS Executions,
           b.total_worker_time-a.total_worker_time AS WorkerMicroseconds,
           b.total_logical_reads-a.total_logical_reads AS LogicalReads
    FROM #QuerySnapshot1 AS a FULL JOIN #QuerySnapshot2 AS b
      ON b.plan_handle=a.plan_handle AND b.sql_handle=a.sql_handle
     AND b.statement_start_offset=a.statement_start_offset
     AND b.statement_end_offset=a.statement_end_offset
     AND b.creation_time=a.creation_time
     AND b.plan_generation_num=a.plan_generation_num
)
SELECT * INTO #QueryComparison FROM Compared;

SELECT Coverage,COUNT_BIG(*) AS StatementRows
FROM #QueryComparison GROUP BY Coverage ORDER BY Coverage;
SELECT query_hash,Executions AS IntervalExecutions,
       WorkerMicroseconds AS IntervalWorkerMicroseconds,
       LogicalReads AS IntervalLogicalReads
FROM #QueryComparison WHERE Coverage='MATCHED' AND Executions>0;

DROP TABLE #QueryComparison;
DROP TABLE #QuerySnapshot2;
DROP TABLE #QuerySnapshot1;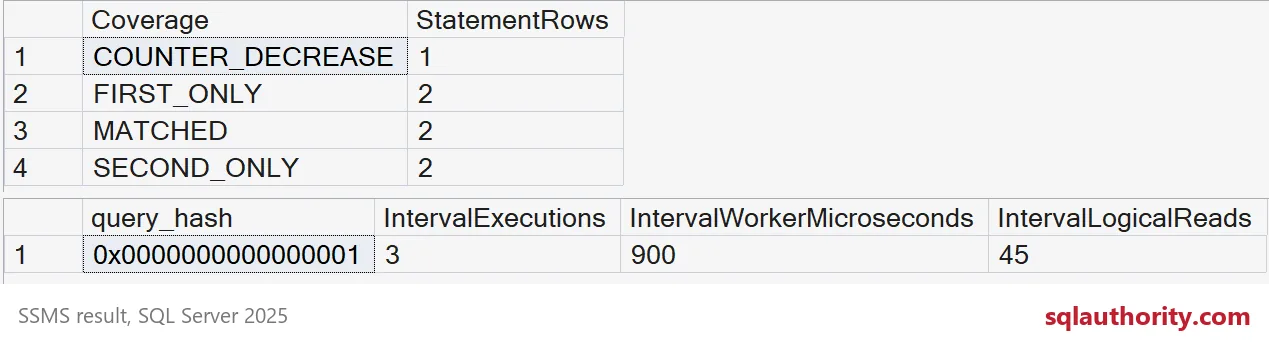
Use the interval result within its limits
Worker time is CPU time, reported in microseconds with millisecond accuracy. Logical reads are page-access counts, not bytes or disk-read counts. Neither column directly measures elapsed response time.
An execution spanning a capture boundary can contribute work outside your chosen gap when its counters become visible. An evicted plan may lose its final counters entirely. Treat the report as observed counter growth, not a complete interval ledger.
A cache restart, eviction or recompilation can reduce comparable coverage. Do not add an unmatched row’s lifetime total to the interval ranking. Preserve the coverage summary so readers can judge what the result supports.
For durable workload history, compare this evidence with Query Store when it is available and collecting the relevant queries. Its capture policy, retention and aggregation intervals also matter. A higher CPU delta suggests where to investigate, rather than proving the cause of a slowdown.
Each capture consumes CPU and temporary storage proportional to the observed cache. Measure that collection cost before scheduling repeated samples. This example collects handles and counters, without retrieving potentially sensitive query text.
Permissions
SQL Server 2022 and later require VIEW SERVER PERFORMANCE STATE for this DMV. Earlier versions use VIEW SERVER STATE. Obtain the appropriate read permission before collecting, without changing services or server configuration.
Run it on a quiet afternoon first, and read the coverage before the ranking.
A counter delta is not a workload ledger, it is growth in what the cache still remembered.
Published by Pinal Dave on SQLAuthority. More of my work at pinaldave.com.
Discover more from SQL Authority with Pinal Dave
Subscribe to get the latest posts sent to your email.