

A 99 percent ratio does not mean your memory is fine. Here is how to read the counter correctly and what to check beside it.

Scale Up or Scale Out: Signs Your Server Needs More Hardware
Decide when to scale up SQL Server by checking sustained CPU demand, memory pressure, storage latency, and whether query tuning comes first.
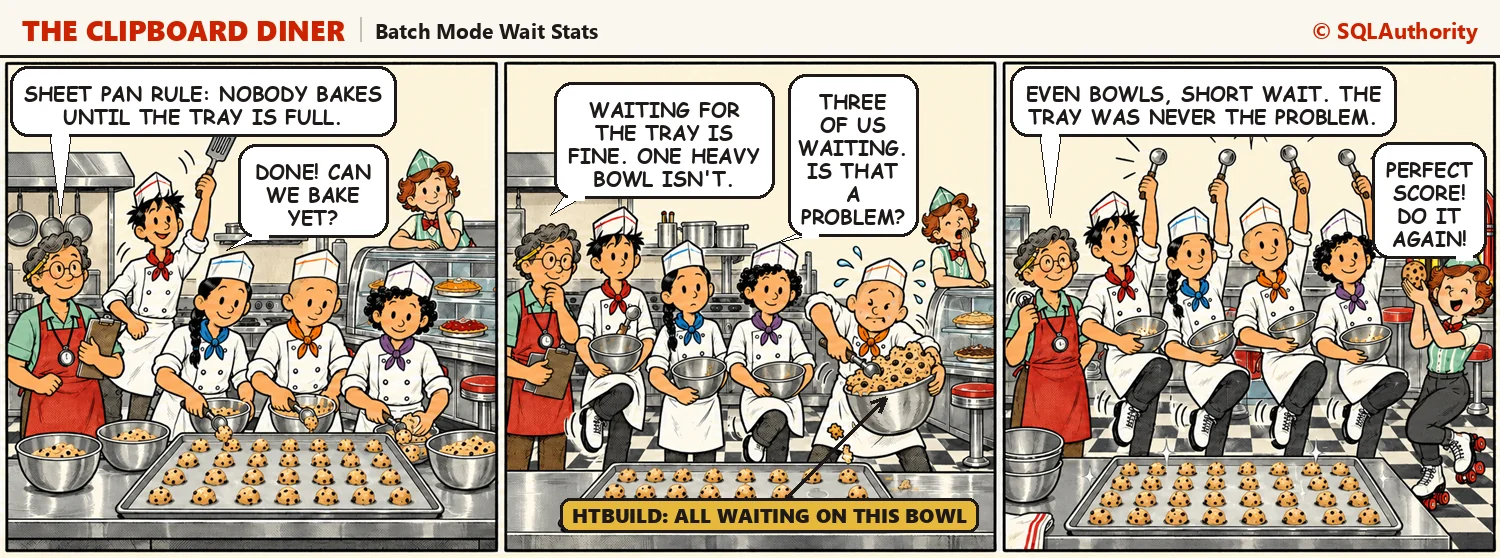
Batch Mode Wait Stats: HTBUILD and Columnstore Waits
Batch mode wait stats such as HTBUILD and BPSORT show threads waiting for each other inside a parallel batch mode plan. On Night 26 at the Clipboard Diner, four cooks wait for one giant shared tray before 900 cookies can bake. Then I show when these waits are normal, when skew or spills make them a problem, and how to check them.
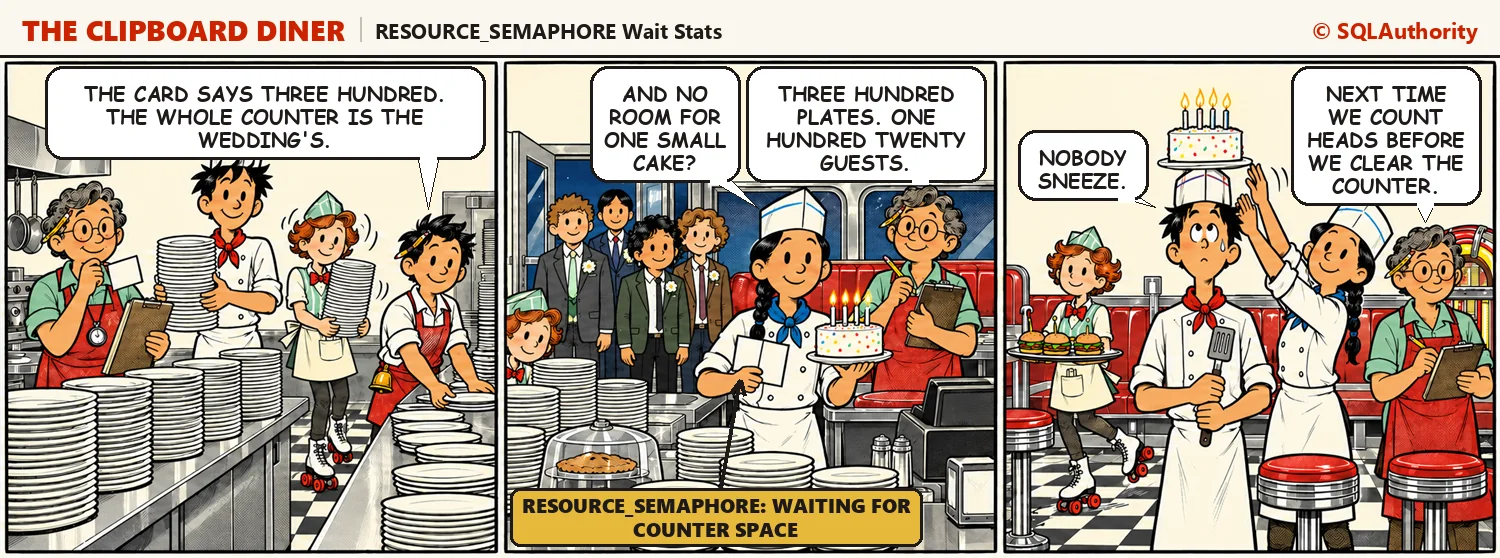
RESOURCE_SEMAPHORE Wait Stats: Memory Grant Waits
RESOURCE_SEMAPHORE wait stats mean a query is waiting for memory before it can even start. On Night 25 at the Clipboard Diner, a wedding party reserves the whole counter and two birthday parties wait. Then I show how to find waiting grants, why grants grow too big, and the fixes I try first.
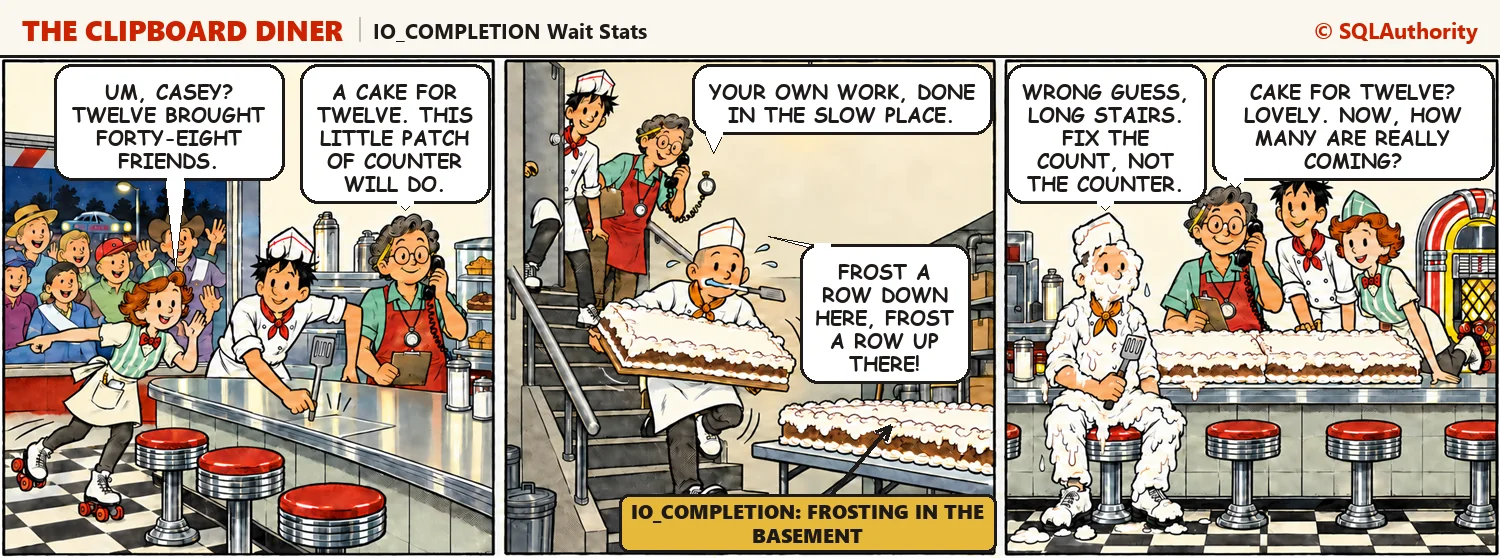
IO_COMPLETION Wait Stats: Spills, Sorts and File Growth
IO_COMPLETION wait stats measure queries waiting on disk work that isn’t a normal data page read, such as sorts and hashes that spill to tempdb. On Night 10 at the Clipboard Diner, a sheet cake for twelve turns out to be for sixty. Learn why spills happen, how to find them, and what SQL Server 2022 changed for log file growth.
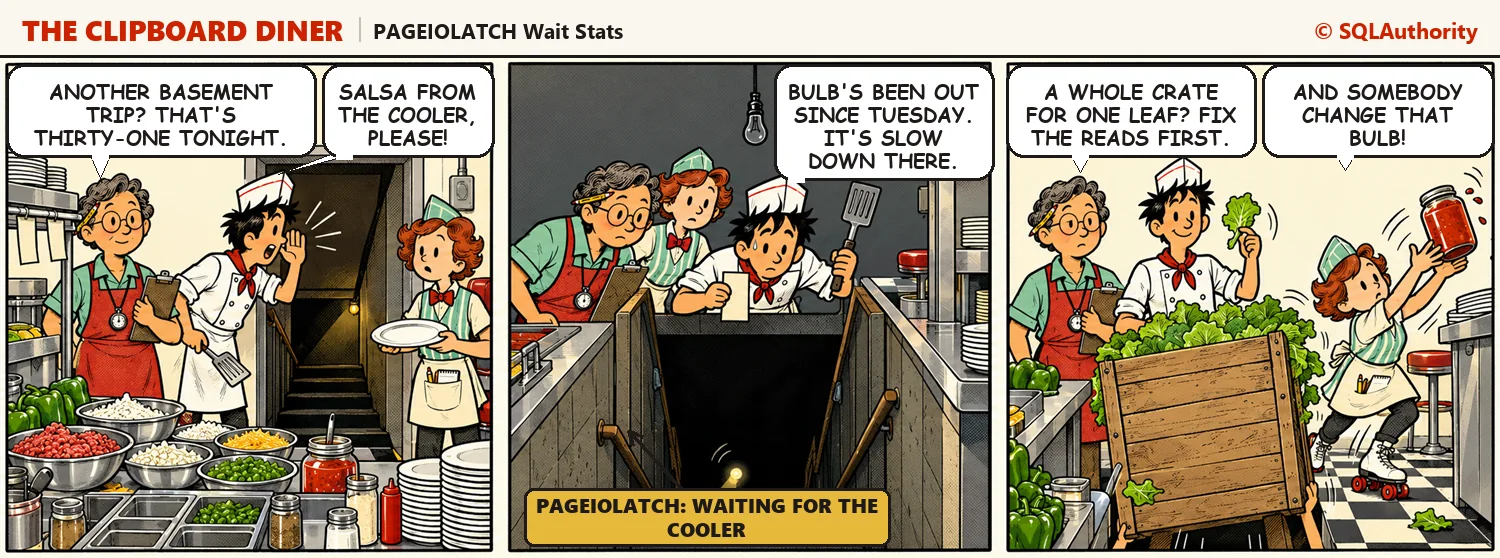
PAGEIOLATCH Wait Stats: Waiting for Data From Disk
PAGEIOLATCH wait stats measure queries waiting while data pages are read from disk into memory. On Night 9 at the Clipboard Diner, the prep counter is too small for the menu and the cooks keep sending for things from the basement. Learn the two causes, how to read file latency per file, and the fixes in order.
SQL SERVER – Plan Cache and Data Cache in Memory
Two scripts I share with clients all the time: they show the plan cache and data cache in memory, with cached plans by size and cached pages by table.