

Identify hot tables with index usage, lock and latch counters, table sizes, and retained snapshots that describe a real workload interval.
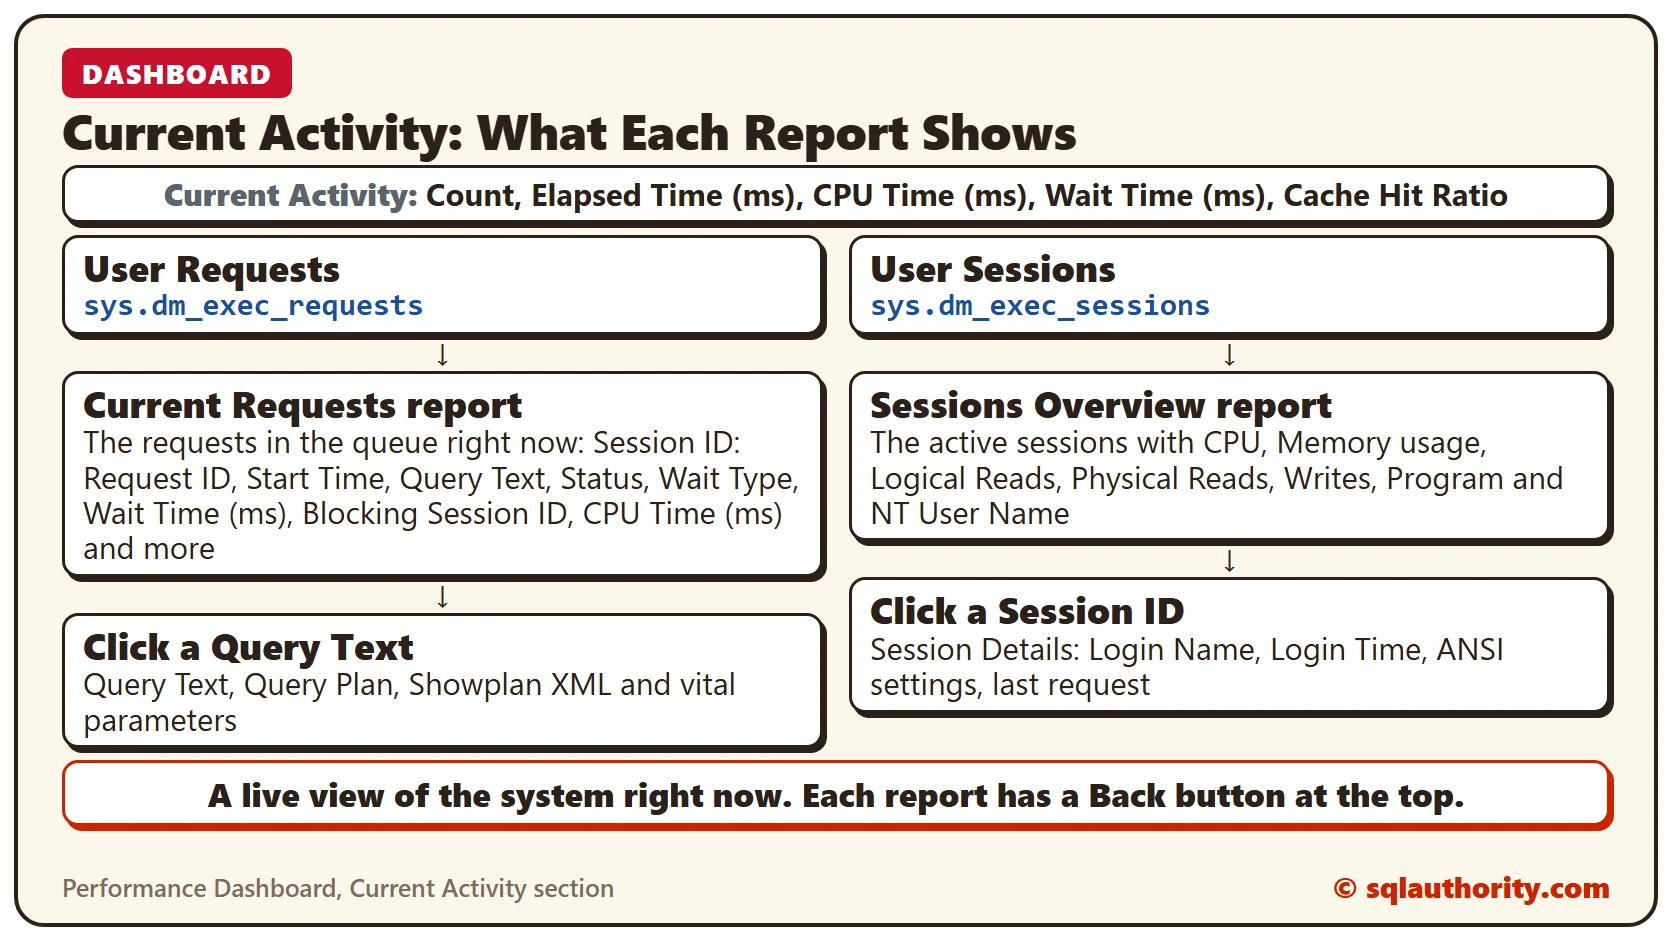
Current Activity Section: Performance Dashboard Reports Explained
The Current Activity section of Performance Dashboard shows what is running right now, split into user requests and user sessions, taken from two DMVs.

Live Execution Plan of a Running Query: SQL in Sixty Seconds #073
A live execution plan shows how far a query has gotten while it is still running. This post builds a slow query on SQL Server 2025, watches it through sys.dm_exec_query_profiles from a second window, and explains why rows divided by the estimate is a progress meter only when the estimate is right.
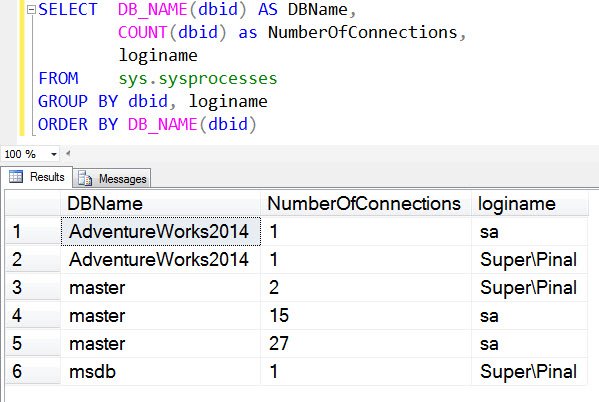
SQL SERVER – How to See Active SQL Server Connections For Database
A reader asked which users are connected to a database and with how many connections. This short script lists active SQL Server connections by login.

Top Resource Consumers in Query Store
Top resource consumers in Query Store show CPU, duration, and reads by query and plan, so tuning starts with workload impact.

Reading the Top Five Wait Types on Your Server
Top five wait types become useful when you filter background waits, measure changes over time, and connect them to active work.

Missing Index Query Text: Linking Suggestions to Their Queries
A missing index suggestion means more when you can see its query. Here is how to link them, trim the text and test the index.