A live execution plan shows how far a query has gotten while it is still running. The estimated plan is a forecast, and the actual plan is a report after the fact. Neither helps with a query that has run for ten minutes. I tested the live numbers on SQL Server 2025.

Three Kinds of Plan
An estimated plan is built before the query runs, so it carries guesses. An actual plan is returned after the query ends, so it carries real counts. A live execution plan sits in between. It is not a picture. It is one row per operator. Each row holds the rows produced so far, next to the rows the optimizer expected. SQL Server publishes it in sys.dm_exec_query_profiles.
The view arrived in SQL Server 2014, and it needs no setup on my test server. Here is my sixty second video on it.
Build a Slow Query
To watch a plan, you need a query that takes a while. This one joins 300 customers to 300,000 orders with a test that has no equals sign. SQL Server cannot match rows by key, so it compares every pair: 90 million pairs in all. Hash joins and merge joins both need an equality to work with. Without one, the optimizer falls back to nested loops. The hint MAXDOP 1 keeps the work on one thread, which makes the numbers easy to read.
IF DB_ID(N'SqlLivePlanDemo') IS NULL CREATE DATABASE SqlLivePlanDemo;
GO
USE SqlLivePlanDemo;
GO
DROP TABLE IF EXISTS dbo.Orders;
DROP TABLE IF EXISTS dbo.Customers;
CREATE TABLE dbo.Customers (CustomerID int PRIMARY KEY, Region varchar(10) NOT NULL, CreditLimit int NOT NULL);
CREATE TABLE dbo.Orders (OrderID int IDENTITY(1,1) PRIMARY KEY, CustomerID int NOT NULL, Amount int NOT NULL);
INSERT INTO dbo.Customers (CustomerID, Region, CreditLimit)
SELECT s.value, CHOOSE(s.value % 4 + 1, 'North', 'South', 'East', 'West'), s.value % 1000
FROM GENERATE_SERIES(1, 3000) AS s;
INSERT INTO dbo.Orders (CustomerID, Amount)
SELECT s.value % 3000 + 1, s.value % 1000
FROM GENERATE_SERIES(1, 300000) AS s;
In the first query window, find your session number. Then start the slow query. It ran for about 21 seconds on my server.
SELECT @@SPID AS LongQuerySession;
SELECT c.Region, COUNT_BIG(*) AS Pairs
FROM dbo.Orders AS o
JOIN dbo.Customers AS c ON ABS(o.Amount - c.CreditLimit) < 600
WHERE c.CustomerID <= 300
GROUP BY c.Region
ORDER BY c.Region
OPTION (MAXDOP 1);
Watch It From Another Window
Open a second window while the first one is busy. Replace 94 with the number from the first window. The query reads one row per operator. It adds a column that divides the rows so far by the estimate. The node_id matches the NodeId in the plan, so you can find each operator in the picture.
SELECT node_id, physical_operator_name, row_count, estimate_row_count,
       CAST(row_count * 100.0 / NULLIF(estimate_row_count, 0) AS decimal(9,1)) AS percent_of_estimate
FROM sys.dm_exec_query_profiles
WHERE session_id = 94
ORDER BY node_id;
I ran it every three seconds while the slow query worked. Here are three of those snapshots. The Table Spool stores rows so the join can replay them for each customer.
| Operator | Estimated rows | Rows at 3 s | Rows at 9 s | Rows at 18 s |
|---|---|---|---|---|
| Clustered Index Scan (Orders) | 300,000 | 300,000 | 300,000 | 300,000 |
| Table Spool | 90,000,000 | 18,324,423 | 45,160,260 | 85,366,705 |
| Nested Loops | 27,000,001 | 13,692,637 | 33,891,418 | 64,090,315 |
| Stream Aggregate | 4 | 0 | 2 | 3 |
Reading the Numbers
The scan of Orders finished almost at once, because 300,000 rows is small. The Table Spool is the real meter. It replays the orders for each customer, and its estimate of 90 million is exact. At 9 seconds it stood at 50 percent, and at 18 seconds at 95 percent. The query ended soon after, and its rows left the view. A query that has finished leaves nothing to read.
The Nested Loops row tells another story. Its estimate was 27 million, and the row count passed that between the 6 and 9 second marks. At 18 seconds it read 237 percent. Nothing was wrong with the query. The optimizer guessed that 30 percent of the pairs would match, and 75 percent did. The final total was 67,545,000 rows.
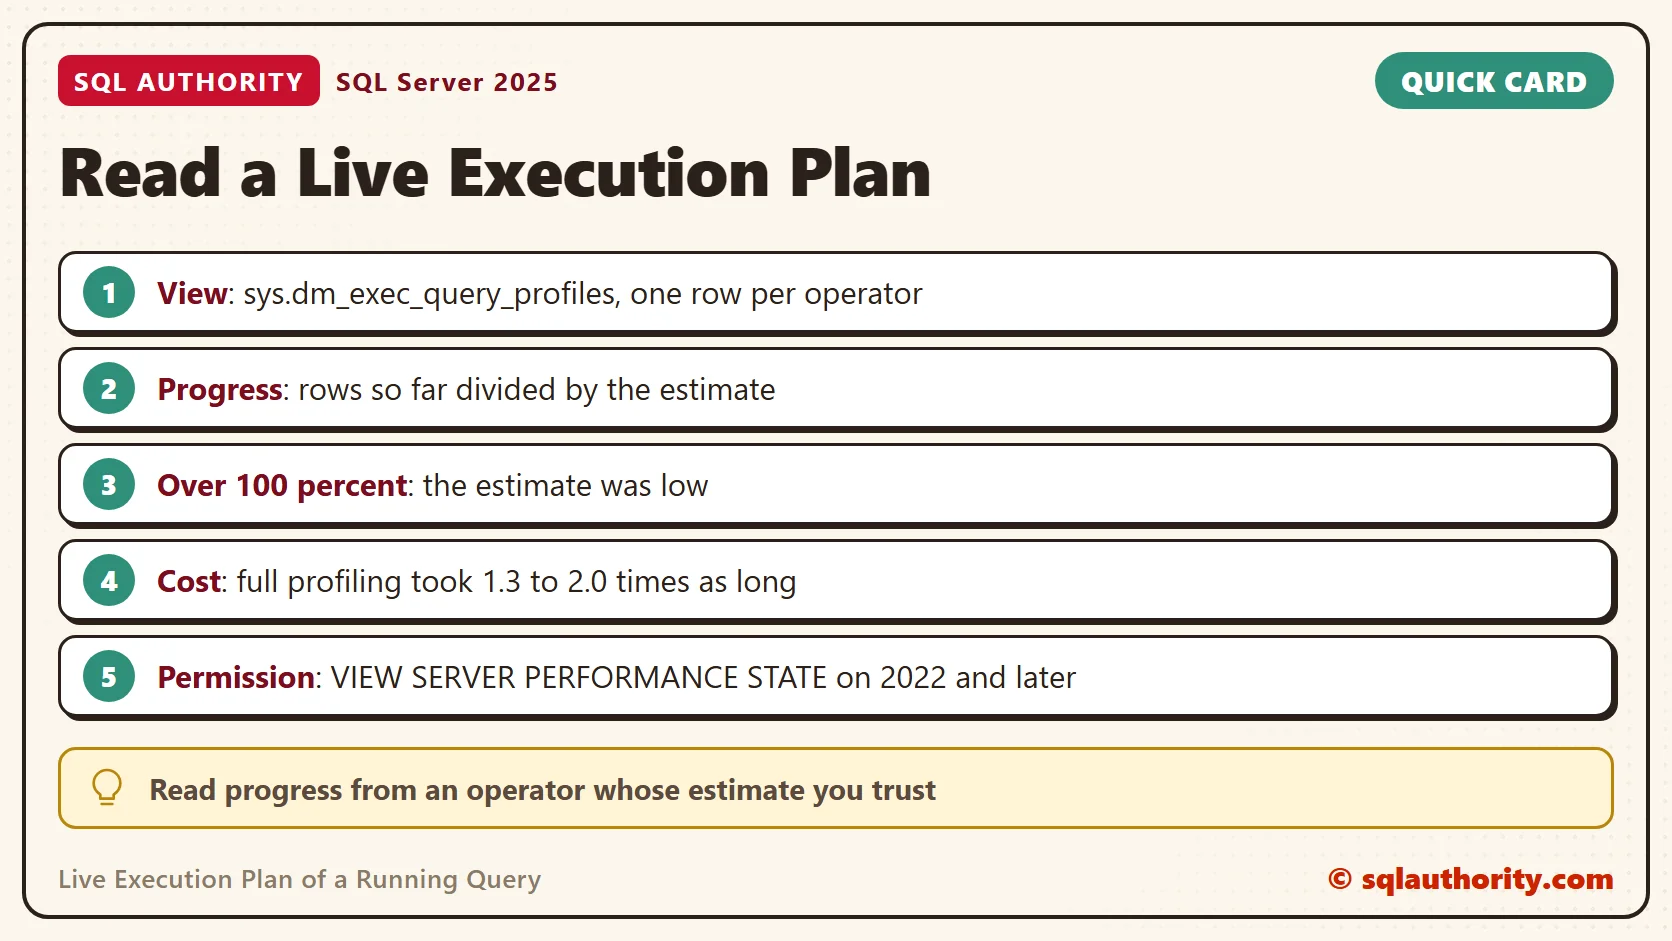
That is the main lesson about a live execution plan. Rows divided by estimate is a progress meter only when the estimate is right. When a percentage passes 100, the estimate was low. Look for an operator whose estimate you trust, and read progress from that one.
The Stream Aggregate shows a different pattern. It had produced no rows at 3 seconds, then 2, then 3, because it emits one region at a time. The estimate of 4 rows was right.
Estimate the Time Left
Two snapshots give you a speed. The Table Spool went from 18,324,423 rows at 3.2 seconds to 45,160,260 rows at 9.3 seconds. That is about 4.4 million rows per second. At 9.3 seconds, 44.8 million rows remained, so the query needed about 10 more seconds.
The prediction said the query would end near 19.5 seconds. It ended at about 21.5. The guess was close enough to decide whether to wait. It works only when the speed stays steady and the estimate for that operator is right.
Time Columns Cost Extra
The same view has columns for elapsed and CPU time per operator. For this query they stayed at zero on my test server. They fill when the session asks for full profiling, for example with SET STATISTICS XML ON in the query window.
Full profiling is not free. I timed a smaller version of this query four times, plain and profiled. The profiled run took 1.3 to 2.0 times as long. Use full profiling for a diagnosis, then turn it off.
Where It Falls Short
You could say Live Query Statistics in SSMS does the same job with a picture. Fair point. It draws these same counters, and it is easier to read at your own desk. The view still has two uses that the picture lacks. It works for a session started by an application. You can also save its rows to a table every few seconds and study them later.
To find the session of an application query, list the running requests and look at the text.
SELECT r.session_id, r.status, r.total_elapsed_time AS ElapsedMs, t.text
FROM sys.dm_exec_requests AS r
CROSS APPLY sys.dm_exec_sql_text(r.sql_handle) AS t
WHERE r.session_id > 50 AND r.session_id <> @@SPID;
A Simple Rule
Reading a live execution plan needs the VIEW SERVER STATE permission. SQL Server 2022 and later use VIEW SERVER PERFORMANCE STATE. Poll every few seconds, not every millisecond. Compare each operator with its own estimate. If one operator passes its estimate by a wide margin, the plan rests on a wrong guess. The fix lies in the statistics or the query, not in waiting.
When you finish testing, remove the example database.
USE master;
GO
ALTER DATABASE SqlLivePlanDemo SET SINGLE_USER WITH ROLLBACK IMMEDIATE;
DROP DATABASE SqlLivePlanDemo;
A live plan is not a forecast or a verdict, it is a progress report.
Published by Pinal Dave on SQLAuthority. More of my work at pinaldave.com.
Discover more from SQL Authority with Pinal Dave
Subscribe to get the latest posts sent to your email.