
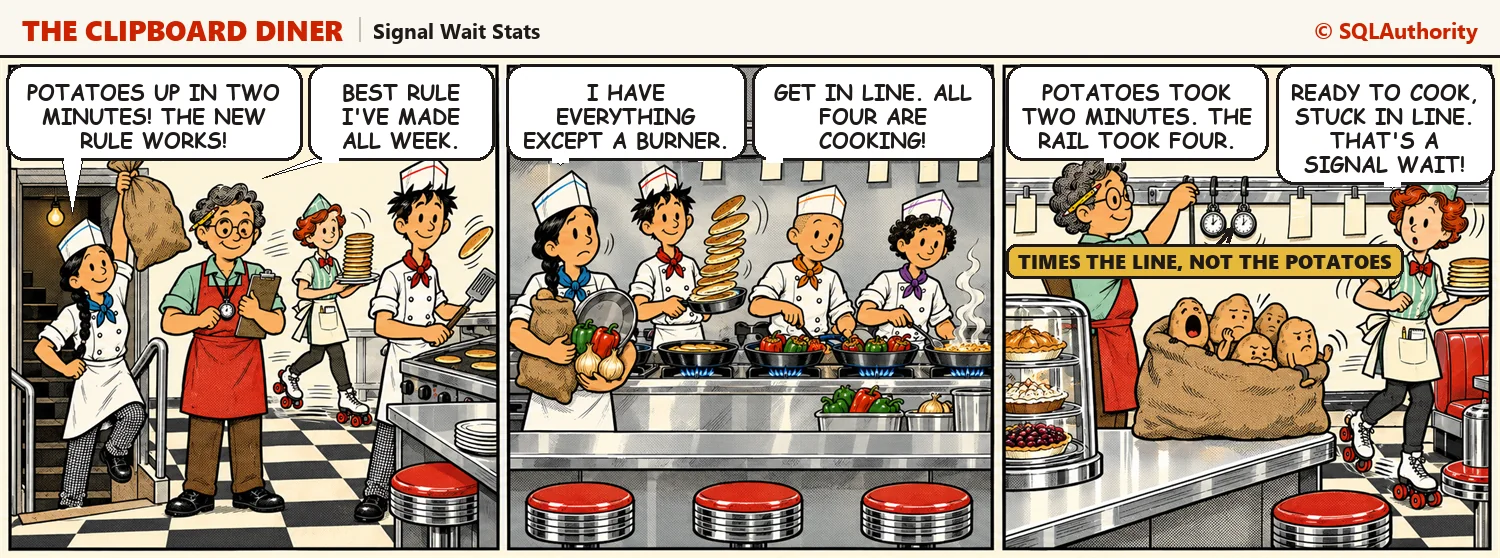
Signal wait stats show how long a SQL Server query sat ready to run, waiting in line for a CPU. On Night 2 at the Clipboard Diner, the potatoes arrive on time and the Garden Hash waits anyway. Then two queries split your server’s waits into the CPU part and the resource part.

Setting MAXDOP and Cost Threshold Sensibly
MAXDOP and cost threshold work together to shape parallel plans; inspect current values, test a change, and watch real workload effects.

Sizing a New SQL Server
Sizing a new SQL Server starts with workload evidence, growth, and recovery goals to estimate CPU, memory, storage, and headroom.

Measure CPU Pressure in SQL Server with Waits and Schedulers
CPU Pressure means tasks are ready to run but every scheduler is busy, so they wait in a queue. This post reads that queue from the schedulers, compares signal waits with resource waits, checks recent CPU history and finds the queries that use the most CPU. It ends with a plain way to decide between a faster CPU, more cores and better queries.

Calculating the Cost of a Slow Query
Cost of a slow query includes frequency, CPU, reads, waits, and user time; learn to turn SQL Server measurements into a practical tuning priority.

Resource Governor: Capping a Runaway Report
Capping a runaway report with Resource Governor uses workload groups, pools, and a tested classifier to limit one workload safely.

How Many CPUs SQL Server Really Uses
CPUs SQL Server really uses depend on edition, guest topology, affinity, and online schedulers; learn to see the instance’s usable capacity.