Question: What is an Edge in a SQL Server execution plan? It is the connection, drawn as an arrow, between operators. SSMS lets you inspect that data flow in Properties. The edge is not itself another execution operator.

This was a small discovery worth sharing: many readers open the Properties of an operator but never select the line joining it to another operator. The label Edge appears when the connection itself is selected.
Try selecting the line
- In SSMS, turn on Include Actual Execution Plan with Ctrl+M.
- Execute a query, then open its Execution Plan tab.
- Select an arrow between operators. Right-click and choose Properties, or press F4.
- Read the selected connection’s row-flow values. Older SSMS versions may label it Edge; current versions may show a generic Properties heading.
Here is a small read-only example for the WideWorldImporters sample database:
USE WideWorldImporters;
GO
-- In SSMS, enable Include Actual Execution Plan (Ctrl+M), then execute.
SELECT TOP (10) InvoiceID, CustomerID
FROM Sales.Invoices
ORDER BY InvoiceID;
The query returns the first ten invoice IDs and their customer IDs. Select the connection feeding the Top operator in its actual plan. SSMS field names and display layout vary by version, so use the actual and estimated row-flow values that your installed version shows.
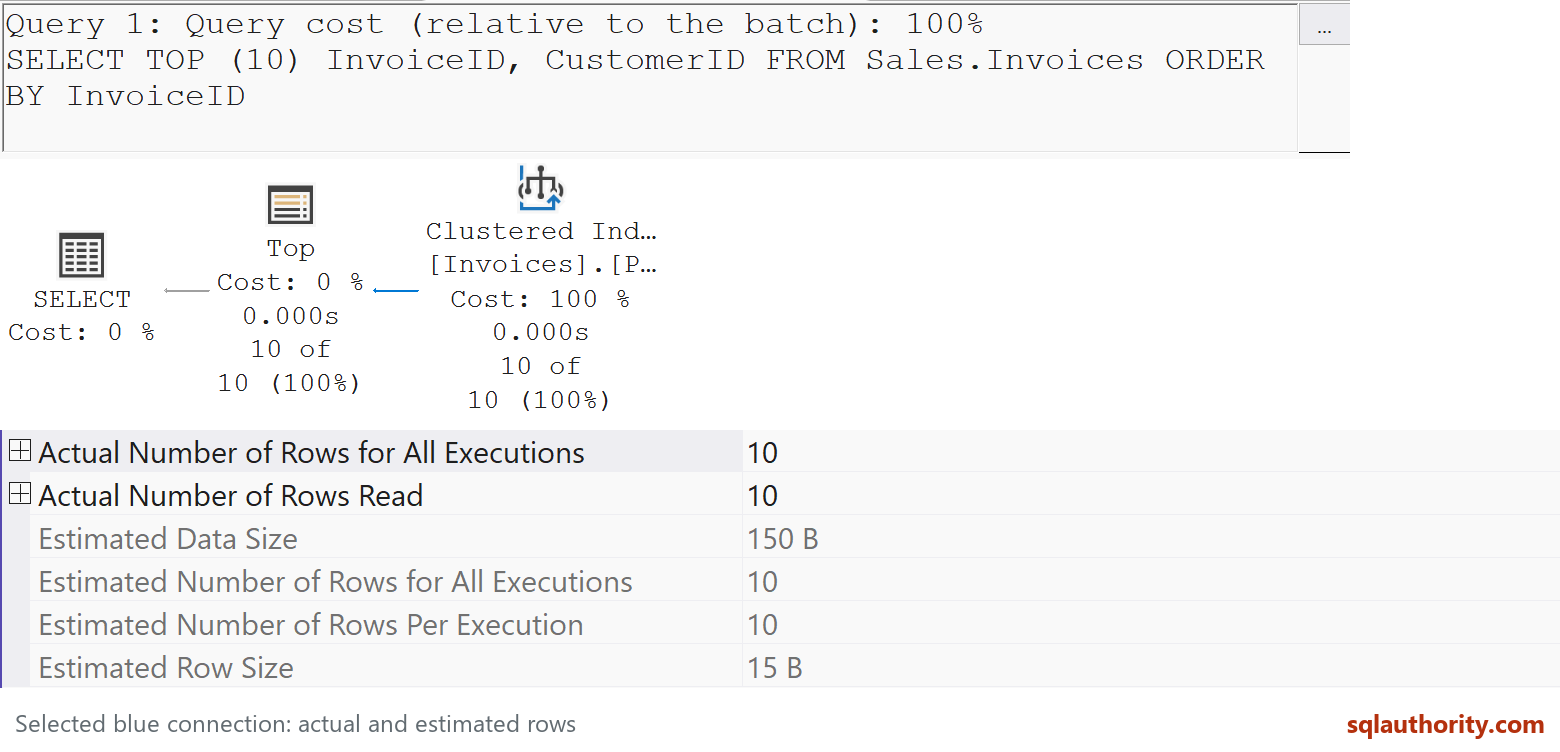
In this SQL Server 2025 and SSMS 22 run, the selected blue line feeds Top. The native properties show ten actual rows for all executions and ten rows read, ten estimated rows per execution and for all executions, an estimated row size of 15 bytes and an estimated data size of 150 bytes. These are connection properties, not measured transfer bytes. This SSMS version uses a generic Properties heading rather than the older literal Edge label. Truncated operator captions are not used to identify the selected object; the complete query and blue line establish the context.
Follow the rows, then ask why
Arrows show data moving from children toward their parent operators. A connection’s row counts help locate where estimates and actual work differ. Distinguish totals across executions from per-execution estimates; a repeated inner input can make that distinction significant.
A thick arrow is a clue to investigate, not a verdict that the query is slow. Likewise, the operator’s estimated cost percentage does not become measured elapsed time merely because you collected an actual plan.
My three ways to display an actual plan article explains the first step.
Published by Pinal Dave on SQLAuthority. More of my work at pinaldave.com.
Discover more from SQL Authority with Pinal Dave
Subscribe to get the latest posts sent to your email.