It is very easy to know what is the queries past and future with the help of the execution plan as well as Dynamic Management Views. However, the biggest challenge is to know the details about the queries current execution status. In this SQL in Sixty Seconds video, we are going to see the details about Live Query Statistics. With the help of the live query statistics features which was introduced in the late SQL Server 2014 / 2016 we can know the current status of the query execution.
Here is the quick video where I describe how to live query statistics works and how it displays the information which you can use it in addition to the actual execution plan.
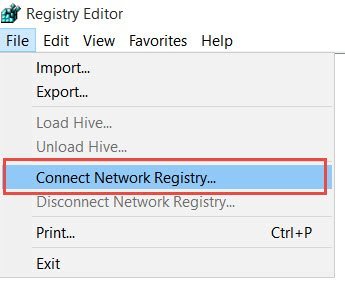
The option can be enabled in SQL Server Management Studio, either by going to the toolbar of the SSMS as shown in the image below.

You can also enable that via Menu >> Query >> Include Live Query Statistics.

I use this feature very heavily during my consulting engagement of Comprehensive Database Performance Health Check. This has helped me solved many of the problems which are difficult to identify and understand.
If you have been using this feature in your real-world scenario, I would like to know the use case of the same. Please leave a comment.
Here are a few additional blog posts which you may find useful.
- SQL SERVER – 3 Different Ways to Explore Actual Execution Plans
- SQL SERVER – Wait Statistics from Query Execution Plan
- Azure Data Studio – Explain SQL Server Execution Plan
- SQL SERVER – Capturing Execution Plan for Canceled Query
- Why Execution Plan Operator Read More Rows Than Available? – Interview Question of the Week #255
- How to Send Execution Plan in Email? – Interview Question of the Week #079
- SQL SERVER – Save and Send Execution Plan Via Email
Reference: Pinal Dave (https://blog.sqlauthority.com)