
When a query runs slow occasionally, the cause sits around the query. It’s a lock, a job, a file growth, tempdb or a shortage of worker threads. Five checks find it, and each check is a short query.

Write Down the Clock First
One case behind this list had a key query that finished in under a second. Occasionally it ran for over 60 seconds. Nothing in the query changed between a fast run and a slow one. Before any check, write down the exact times when the query runs slow occasionally. Every check below asks the same question: what else happened then?
Check 1: Blocking
Another session can hold a lock that your query needs. Your query then waits, and the wait looks like slowness. The demo database OccasionalSlowDemo has a small Orders table. The script also sets up the file growth check that comes later.
IF DB_ID(N'OccasionalSlowDemo') IS NULL CREATE DATABASE OccasionalSlowDemo;
GO
USE OccasionalSlowDemo;
GO
DROP TABLE IF EXISTS dbo.Orders;
CREATE TABLE dbo.Orders (
    OrderID int          NOT NULL PRIMARY KEY,
    Status  nvarchar(12) NOT NULL
);
INSERT INTO dbo.Orders (OrderID, Status)
VALUES (1, N'New'), (2, N'New'), (3, N'New');
In window 1, change an order and leave the transaction open. In window 2, change the same order. Window 2 now waits.
USE OccasionalSlowDemo;
BEGIN TRANSACTION;
UPDATE dbo.Orders SET Status = N'Packing' WHERE OrderID = 1;
USE OccasionalSlowDemo;
UPDATE dbo.Orders SET Status = N'Shipped' WHERE OrderID = 1;
In window 3, list every request that waits for another session. The column blocking_session_id names the blocker.
SELECT w.session_id AS WaitingSession, w.blocking_session_id AS BlockedBy, w.wait_type, w.wait_time AS WaitMs, t.text AS WaitingText
FROM sys.dm_exec_requests AS w
CROSS APPLY sys.dm_exec_sql_text(w.sql_handle) AS t
WHERE w.blocking_session_id <> 0;
| WaitingSession | BlockedBy | wait_type | WaitMs | WaitingText |
|---|---|---|---|---|
| 56 | 52 | LCK_M_X | 3146 | (@1 nvarchar(4000),@2 tinyint)UPDATE [dbo].[Orders] set [Status] = @1 WHERE [OrderID]=@2 |
Your session numbers and wait time will differ.
Session 56 waits, and session 52 is the blocker. A wait type that starts with LCK_M is a lock wait. The statement text shows parameters instead of the literals, because SQL Server parameterized the update. The older tool for this check is sp_who2, which names the blocker in its BlkBy column. This query adds the statement text. Release window 1 now.
ROLLBACK TRANSACTION;
Check 2: Maintenance Work
Backups, statistics updates, index rebuilds and consistency checks compete with your query for disk and CPU. Maintenance is normal and necessary, so the question is only when it runs. Two queries test this. The first lists maintenance that runs right now. It returns no rows when the server is quiet.
SELECT r.session_id, r.command, DB_NAME(r.database_id) AS DatabaseName, r.percent_complete, r.total_elapsed_time AS ElapsedMs
FROM sys.dm_exec_requests AS r
WHERE r.session_id <> @@SPID
  AND (r.command LIKE N'BACKUP%' OR r.command LIKE N'RESTORE%' OR r.command LIKE N'DBCC%'
       OR r.command LIKE N'ALTER INDEX%' OR r.command LIKE N'UPDATE STATISTICS%');
The second query builds a timeline of the last 24 hours from the backup history and the Agent job history. Hold its start times against the times of your slow runs. The job part stays empty when SQL Server Agent isn’t used or its history was cleared.
SELECT N'Backup' AS Source, b.database_name AS Name, b.backup_start_date AS StartedAt,
       DATEDIFF(SECOND, b.backup_start_date, b.backup_finish_date) AS Seconds
FROM msdb.dbo.backupset AS b
WHERE b.backup_start_date >= DATEADD(DAY, -1, GETDATE())
UNION ALL
SELECT N'Agent job', j.name, msdb.dbo.agent_datetime(h.run_date, h.run_time),
       (h.run_duration / 10000) * 3600 + ((h.run_duration / 100) % 100) * 60 + h.run_duration % 100
FROM msdb.dbo.sysjobhistory AS h
JOIN msdb.dbo.sysjobs AS j ON j.job_id = h.job_id
WHERE h.step_id = 0 AND msdb.dbo.agent_datetime(h.run_date, h.run_time) >= DATEADD(DAY, -1, GETDATE())
ORDER BY StartedAt;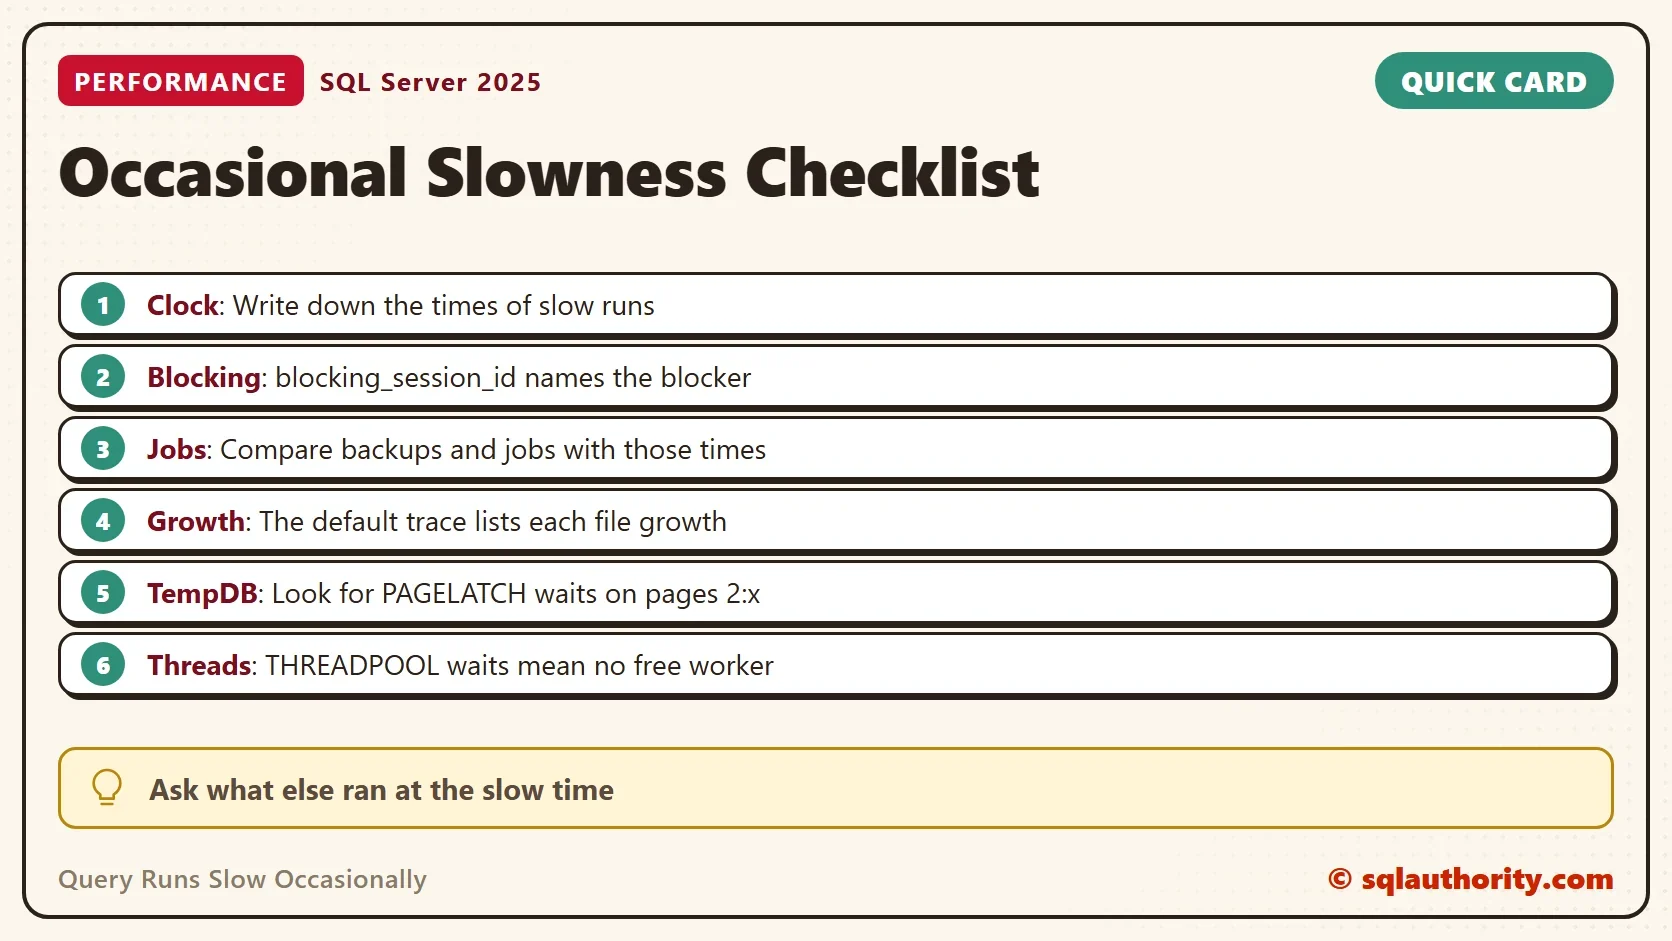
Check 3: File Growth
When a data or log file is full, SQL Server grows it. Sessions that need space wait until the growth ends. A small growth step makes this happen again and again. The demo database starts with a 1 MB growth step, the setting that causes the trouble.
ALTER DATABASE OccasionalSlowDemo MODIFY FILE (NAME = N'OccasionalSlowDemo', FILEGROWTH = 1MB);
ALTER DATABASE OccasionalSlowDemo MODIFY FILE (NAME = N'OccasionalSlowDemo_log', FILEGROWTH = 1MB);
GO
SELECT name AS FileName, type_desc AS FileType, size * 8 / 1024 AS SizeMB,
       CASE WHEN is_percent_growth = 1 THEN CONCAT(growth, N' percent') ELSE CONCAT(growth * 8 / 1024, N' MB') END AS GrowthStep
FROM sys.database_files;| FileName | FileType | SizeMB | GrowthStep |
|---|---|---|---|
| OccasionalSlowDemo | ROWS | 8 | 1 MB |
| OccasionalSlowDemo_log | LOG | 8 | 1 MB |
Now load 30,000 rows of about 1,000 bytes each. The default trace records every file growth, so the second query counts them. Data files are event 92 and log files are event 93. The trace is on unless someone turned it off.
DROP TABLE IF EXISTS dbo.OrderNotes;
CREATE TABLE dbo.OrderNotes (NoteID int NOT NULL PRIMARY KEY, Note char(1000) NOT NULL);
SELECT GETDATE() AS LoadStarted INTO #Mark;
INSERT INTO dbo.OrderNotes (NoteID, Note)
SELECT TOP (30000) ROW_NUMBER() OVER (ORDER BY (SELECT NULL)), ''
FROM sys.all_objects AS a CROSS JOIN sys.all_objects AS b;
DECLARE @trace nvarchar(260) = (SELECT path FROM sys.traces WHERE is_default = 1);
SELECT CASE t.EventClass WHEN 92 THEN N'Data file' ELSE N'Log file' END AS FileKind,
       COUNT(*) AS Growths,
       CONVERT(decimal(9,1), SUM(t.IntegerData * 8 / 1024.0)) AS GrownMB,
       SUM(t.Duration) / 1000 AS TotalPauseMs
FROM sys.fn_trace_gettable(@trace, DEFAULT) AS t
WHERE t.EventClass IN (92, 93) AND t.DatabaseName = DB_NAME() AND t.StartTime >= (SELECT LoadStarted FROM #Mark)
GROUP BY t.EventClass
ORDER BY t.EventClass;| FileKind | Growths | GrownMB | TotalPauseMs |
|---|---|---|---|
| Data file | 30 | 30.0 | 45 |
| Log file | 44 | 44.0 | 236 |
The load grew the data file 30 times and the log file 44 times. Your counts will differ. Each pause is small on this fast disk, and the total stays under half a second. On slower storage every growth takes longer, and a session that arrives during one waits for it.
The fix is a growth step that matches your real growth, so the file grows rarely and in one piece. The script sets 64 MB and loads the same amount of data again.
ALTER DATABASE OccasionalSlowDemo MODIFY FILE (NAME = N'OccasionalSlowDemo', FILEGROWTH = 64MB);
ALTER DATABASE OccasionalSlowDemo MODIFY FILE (NAME = N'OccasionalSlowDemo_log', FILEGROWTH = 64MB);
GO
DELETE FROM #Mark;
INSERT INTO #Mark (LoadStarted) VALUES (GETDATE());
INSERT INTO dbo.OrderNotes (NoteID, Note)
SELECT TOP (30000) 100000 + ROW_NUMBER() OVER (ORDER BY (SELECT NULL)), ''
FROM sys.all_objects AS a CROSS JOIN sys.all_objects AS b;
Run the growth query again. It counts only the growths since the second load began. It now reports one growth per file, 64 MB each, and the pauses total 4 ms and 34 ms.
| FileKind | Growths | GrownMB | TotalPauseMs |
|---|---|---|---|
| Data file | 1 | 64.0 | 4 |
| Log file | 1 | 64.0 | 34 |
Check 4: TempDB
Every database on the server shares tempdb. When many sessions create temporary objects at once, they queue on latches of the same allocation pages. Those waits are PAGELATCH waits on pages of database 2, so the wait resource starts with 2:. The first query compares the data files with the schedulers. The second lists requests waiting on a tempdb page right now.
SELECT COUNT(*) AS TempdbDataFiles,
       (SELECT COUNT(*) FROM sys.dm_os_schedulers WHERE status = N'VISIBLE ONLINE') AS Schedulers
FROM tempdb.sys.database_files
WHERE type = 0;
SELECT r.session_id, r.wait_type, r.wait_resource
FROM sys.dm_exec_requests AS r
WHERE r.wait_type LIKE N'PAGELATCH%' AND r.wait_resource LIKE N'2:%';
This server has 8 data files for 16 schedulers, and no session waits on a tempdb page at the moment. One data file per scheduler, up to eight, is the usual starting point. Run the second query during a slow period, not afterward. To find the query that fills tempdb, read Find the Query Growing TempDB in SQL Server.
Check 5: ThreadPool Waits
Every request needs a worker thread. When all workers are busy, a new request waits with the wait type THREADPOOL. The user sees a stall that no lock explains. The query shows the totals since the server started, the limit and the tasks queued now.
SELECT w.waiting_tasks_count AS ThreadPoolWaits, w.wait_time_ms AS ThreadPoolWaitMs,
       i.max_workers_count AS MaxWorkers,
       (SELECT SUM(work_queue_count) FROM sys.dm_os_schedulers WHERE status = N'VISIBLE ONLINE') AS TasksQueuedNow
FROM sys.dm_os_wait_stats AS w
CROSS JOIN sys.dm_os_sys_info AS i
WHERE w.wait_type = N'THREADPOOL';| ThreadPoolWaits | ThreadPoolWaitMs | MaxWorkers | TasksQueuedNow |
|---|---|---|---|
| 274529 | 357961 | 704 | 0 |
This development server shows 274,529 waits since it started, which says little alone. Read the numbers twice, a few minutes apart. A count that climbs during the slow periods is the signal. A THREADPOOL count that climbs points to long blocking chains or to parallel plans that hold many workers. Look there first. For the limit and the default of 0, read Optimal Value for Max Worker Threads in SQL Server.
When the Five Checks Find Nothing
The same query text can get two different plans. A different parameter value, or fresh statistics, is enough. A query that is fast for one value and slow for another points there. Query Store keeps each plan a query has used, with its runtime numbers, so you can compare them. A literal list and a subquery can get different plans too, so compare the two actual plans. Test the query with both values before you suspect the server.
Azure SQL Database has no SQL Server Agent, and it offers sys.dm_db_wait_stats in place of the server wait statistics. On Azure SQL Managed Instance, test each check before you rely on it. The default trace and msdb can differ.
Why Not Read the Wait Statistics Alone?
You could argue that one wait statistics query finds all five causes at once. It points the right way. It can’t name the moment, because the totals add up everything since the server started. When a query runs slow occasionally, you need a time, and the five checks give you one.
What to Remember
Write down when the slow runs happen, then work through the five checks in order, from the cheapest. When a query runs slow occasionally, look for its neighbor. It’s a lock, a job, a growth, a tempdb queue or a thread shortage. The checks only read, except the growth step you choose to change.
When you finish the demo, drop the database.
USE master;
GO
IF DB_ID(N'OccasionalSlowDemo') IS NOT NULL
BEGIN
    ALTER DATABASE OccasionalSlowDemo SET SINGLE_USER WITH ROLLBACK IMMEDIATE;
    DROP DATABASE OccasionalSlowDemo;
END;
A slow query is not bad luck, it is a query waiting on something you can name.
Published by Pinal Dave on SQLAuthority. More of my work at pinaldave.com.
Discover more from SQL Authority with Pinal Dave
Subscribe to get the latest posts sent to your email.



2 Comments. Leave new
how much of this applies to azure?
Example:1 Select * From View where date=@date and Actcd IN(‘100′,’200’)
Example:2 Select * From View Where date=@date and Actcd IN(Select Actcd From tb1 where Id=2)
Select Actcd From tb1 where Id=2 gives values ‘100’,’200′
Hello sir,
In Above example:1 for Actcd literal values are passed and it runs fast but when i use example:-2 query get stuck and slow.
sir can you please give explain such behaviour of SQL server as i need to use dynamic query like in example-2.
Is this because of query plan?