Runnable sessions are sessions that have everything they need except a free CPU. A long list of them next to a CPU that looks half idle seems like a contradiction. Start with the heaviest statements. Use the list below when they are tuned and the queue stays.

Count the Requests by Status
Most requests are running, runnable or suspended. A few show other states, such as sleeping. A running request has a CPU. A suspended request waits for a lock, a disk or another resource. A runnable request is ready and waits for its turn on a CPU. The first query counts user requests by status and leaves the background tasks out.
SELECT r.status, COUNT(*) AS Requests
FROM sys.dm_exec_requests AS r
WHERE r.session_id > 50 AND r.session_id <> @@SPID AND r.status <> N'background'
GROUP BY r.status
ORDER BY Requests DESC;
| status | Requests |
|---|---|
| sleeping | 21 |
| suspended | 1 |
On the shared test server, one sample showed 21 sleeping requests and one suspended request. None was running or runnable. A runnable count above zero that stays above zero across samples points to CPU contention. One sample proves little, so repeat the query for a minute.
Check That SQL Server Sees Every CPU
A queue next to idle CPU can mean that SQL Server uses fewer processors than the machine has. Some editions limit the sockets and cores they use. An affinity setting can limit them too. The extra schedulers then show as offline, and the online ones carry the whole load.
SELECT i.cpu_count, i.scheduler_count, i.affinity_type_desc,
       SUM(CASE WHEN sc.status = N'VISIBLE ONLINE' THEN 1 ELSE 0 END) AS OnlineSchedulers,
       SUM(CASE WHEN sc.status = N'VISIBLE OFFLINE' THEN 1 ELSE 0 END) AS OfflineSchedulers
FROM sys.dm_os_sys_info AS i
CROSS JOIN sys.dm_os_schedulers AS sc
WHERE sc.scheduler_id < 255
GROUP BY i.cpu_count, i.scheduler_count, i.affinity_type_desc;| cpu_count | scheduler_count | affinity_type_desc | OnlineSchedulers | OfflineSchedulers |
|---|---|---|---|---|
| 16 | 16 | AUTO | 16 | 0 |
The test server sees 16 CPUs and has 16 online schedulers, so nothing is hidden. Compare your own numbers. Offline schedulers on a busy server are the first thing to fix. Look at the edition limit, the affinity setting and the licensing.
Read the Settings That Cap the CPU
Three settings change how much CPU a workload gets. The parallelism setting decides how many CPUs one query can use. The affinity masks pin SQL Server to some CPUs. Resource Governor can cap a group of sessions. This script only reads them.
SELECT name, value_in_use
FROM sys.configurations
WHERE name IN (N'max degree of parallelism', N'cost threshold for parallelism', N'affinity mask', N'affinity I/O mask')
ORDER BY name;

SELECT is_enabled FROM sys.resource_governor_configuration;

SELECT name, min_cpu_percent, max_cpu_percent, cap_cpu_percent FROM sys.resource_governor_resource_pools;
| name | value_in_use |
|---|---|
| affinity I/O mask | 0 |
| affinity mask | 0 |
| cost threshold for parallelism | 50 |
| max degree of parallelism | 2 |
| is_enabled |
|---|
| 0 |
| name | min_cpu_percent | max_cpu_percent | cap_cpu_percent |
|---|---|---|---|
| internal | 0 | 100 | 100 |
| default | 0 | 100 | 100 |
The test server has no affinity mask, and Resource Governor is off. Both pools can use 100 percent of the CPU. The parallelism setting is 2, so one query uses at most two CPUs. A server left at 0 lets one query spread over every CPU. A few such queries can fill the queue.
One Session Can Hold Many Tasks
A session is not a task. A parallel query is one session with several tasks, and each task needs its own turn on a CPU. The scheduler view counts tasks, and the request view counts sessions. A few parallel queries can fill the queue while the session count looks small. This query lists the requests that hold more than one task.
SELECT r.session_id, COUNT(*) AS Tasks, MAX(r.cpu_time) AS CpuTimeMs
FROM sys.dm_exec_requests AS r
JOIN sys.dm_os_tasks AS t ON t.session_id = r.session_id AND t.request_id = r.request_id
WHERE r.session_id > 50
GROUP BY r.session_id
HAVING COUNT(*) > 1
ORDER BY Tasks DESC;
The query returns no row on the quiet test server. On a busy one, a session can hold more tasks than its parallelism setting. It still uses at most that many schedulers, but each runnable task waits for its turn.
List the Runnable Requests
When the queue is real, find the statements in it. This query lists every runnable request with its CPU time so far and the start of its text. Run it several times, because a queue changes by the millisecond.
SELECT r.session_id, r.status, r.cpu_time, r.wait_type, DB_NAME(r.database_id) AS DatabaseName, LEFT(t.text, 60) AS StatementStart
FROM sys.dm_exec_requests AS r
CROSS APPLY sys.dm_exec_sql_text(r.sql_handle) AS t
WHERE r.status = N'runnable' AND r.session_id > 50;
The test server returns no row, because it isn’t CPU bound. Under pressure, each row is one session waiting for a CPU. The cpu_time column shows who already used a lot of it. Read the statement text and send the top ones to tuning.
Check the Power Plan and the Host
If the settings look right and the queue stays, look below SQL Server. A Windows power plan that saves energy slows each CPU. Every task then needs more time on it, and the queue grows. A virtual server adds another layer, because the host can hand out less CPU than the guest believes it has. Neither shows up in these queries.
You could argue that a few runnable sessions are normal. That’s true. Every task passes through the runnable state many times a second, and a single sample can catch a few. The signal is a queue that stays across samples while users wait.
What to Remember
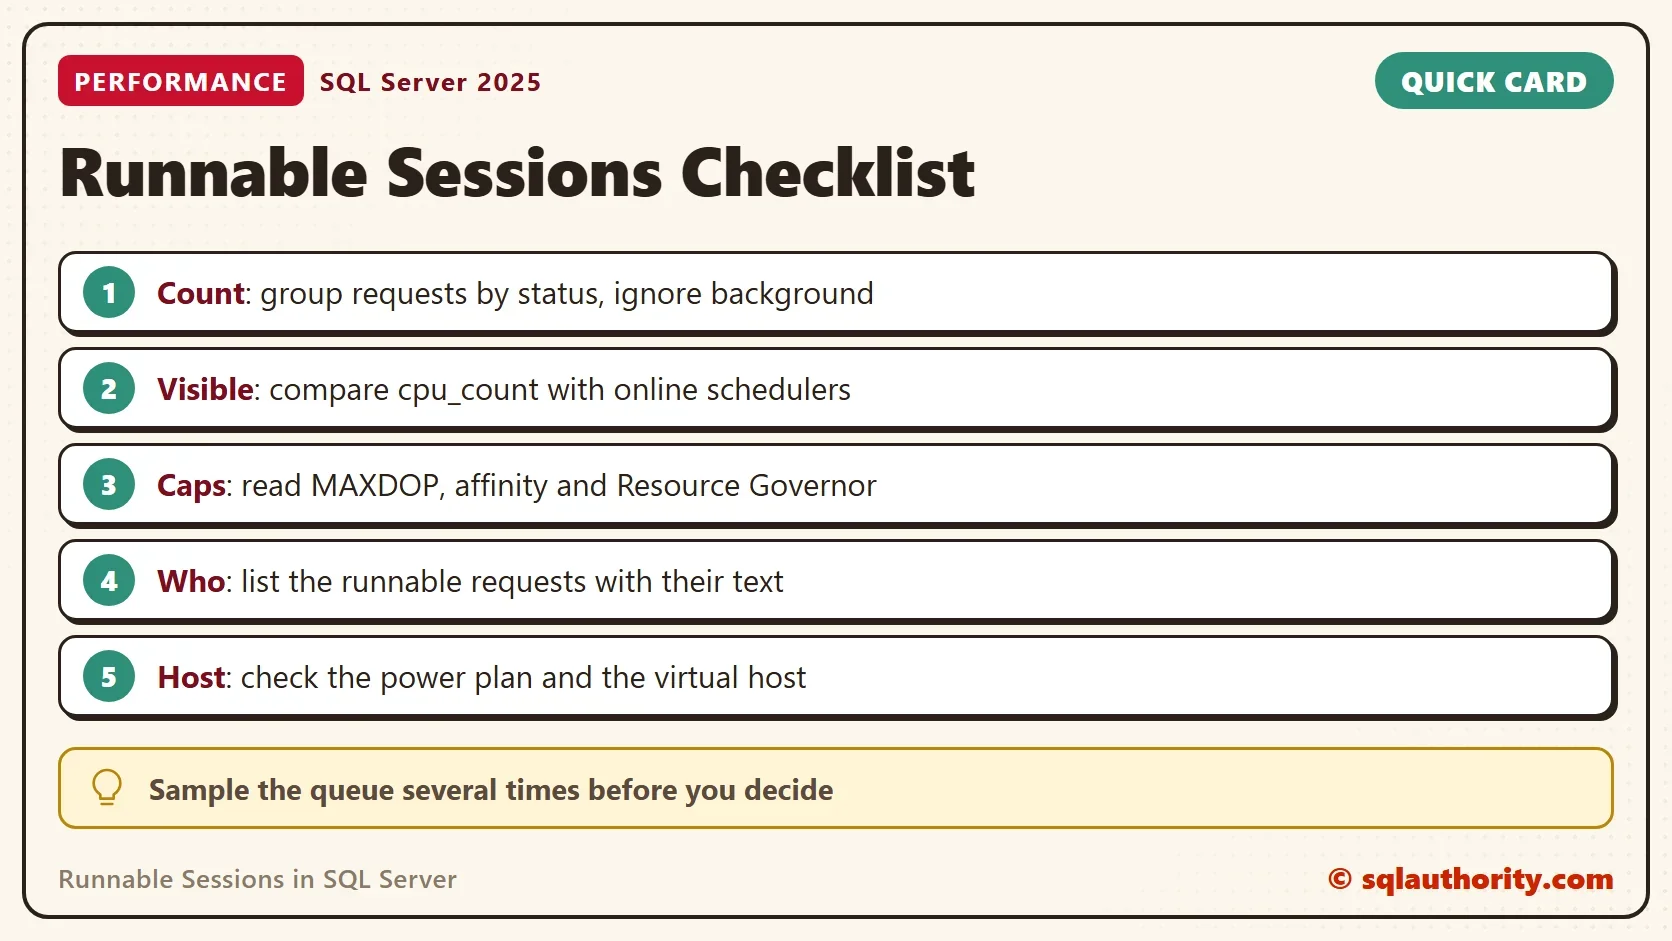
To investigate runnable sessions, work through the checks in order. For the wait side, read Signal Waits: Detect CPU Pressure With Wait Statistics. For the scheduler queue, read Measure CPU Pressure in SQL Server with Waits and Schedulers. Count the requests by status and compare the CPU count with the online schedulers. Read the caps, list the runnable requests, and then check the power plan and the host. Most queues end when the heavy statements are tuned and the settings are right.
Fix the heavy statements first, because a tuned query frees CPU for everyone. Then change settings one at a time, and sample the queue again after each change.
Runnable sessions are not a CPU shortage, they are a question about who is holding the CPU.
Published by Pinal Dave on SQLAuthority. More of my work at pinaldave.com.
Discover more from SQL Authority with Pinal Dave
Subscribe to get the latest posts sent to your email.