As a DBA or SQL Developer, the amount of time we work with SQL Server Management can never be measured. As a database person, these hidden gems of SQL Server can never be underestimated. With each release the tool improves to give the next set of features. I have seen in multiple blogs where the Product Managers constantly ask for feedbacks and are looking at making enhancements to the tool. If you goto the connect site, the votes for a feature requests decides if they will ever make it into the next release of SSMS. If you get the drift, knowing the statistics on a given request decides how the feature will get added. These statistics and questions gives product team the confidence to people’s request. Similarly when working with SQL Server objects, it will be useful if we can know how many times a procedure were called and how many CPU, IO cycles were spent. Let’s see Resource Locking and Object Execution Statistics Report.
In this part of blog we would talk about two reports from the Database level standard reports as shown in the diagram.

Resource Locking Statistics by Objects
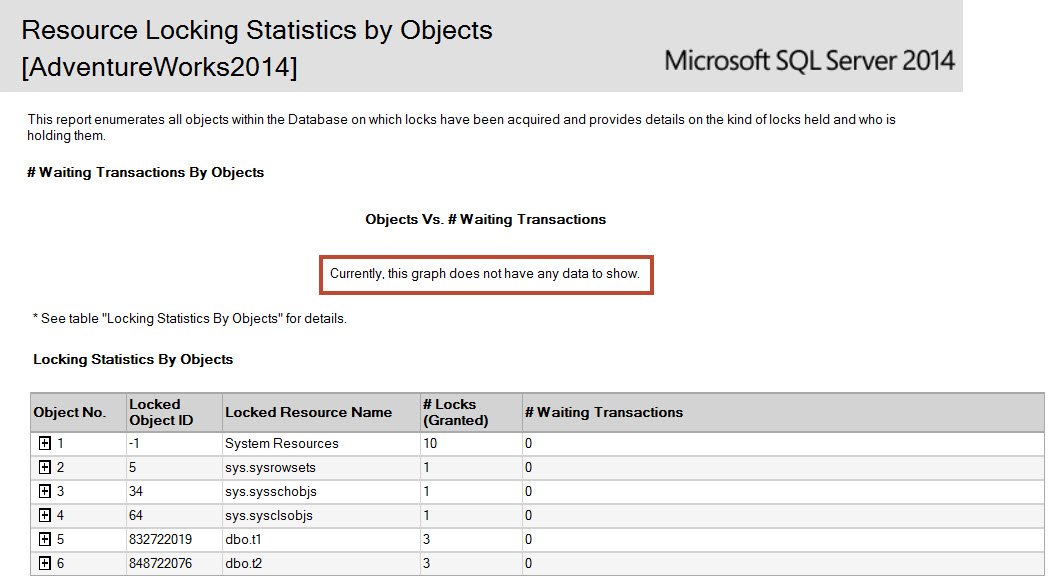
This report is similar to earlier blocking report which is available at server level. Since this report is database level, it shows information about blocking within the database for which we launched the report. In case of no blocking in the database, the report would launch and show message as below:
“Currently, this graph does not have any data to show”. This is shown in the diagram below.

For demonstrate purpose I have created two blocking chains, one for table t1 and another for table t2. And have launched the repot again. If we compare this with earlier report, it’s clearly visible that the warning is not available and as highlighted in the image, we can see non-zero value under “# Waiting Transactions”. Without clicking on (+) it would not be possible to see who is blocked.

Once we expand Object No. 1, below is what we get. We can clearly see that there are 5 locks which are granted and 1 lock on RID is in WAIT status. The SPID is shown at the same level.

The majority of blocking information in this report is picked from DMV sys.dm_tran_locks and sys.dm_exec_sessions. Other information about object metadata is from catalog views – sys.partitions, sys.objects, sys.schemas
Here is the list of possible locks shown in the report: METADATA, DATABASE, FILE, TABLE, HOBT, EXTENT, PAGE, KEY, RID, ALLOCATION_UNIT and APPLICATION.
Object Execution Statistics
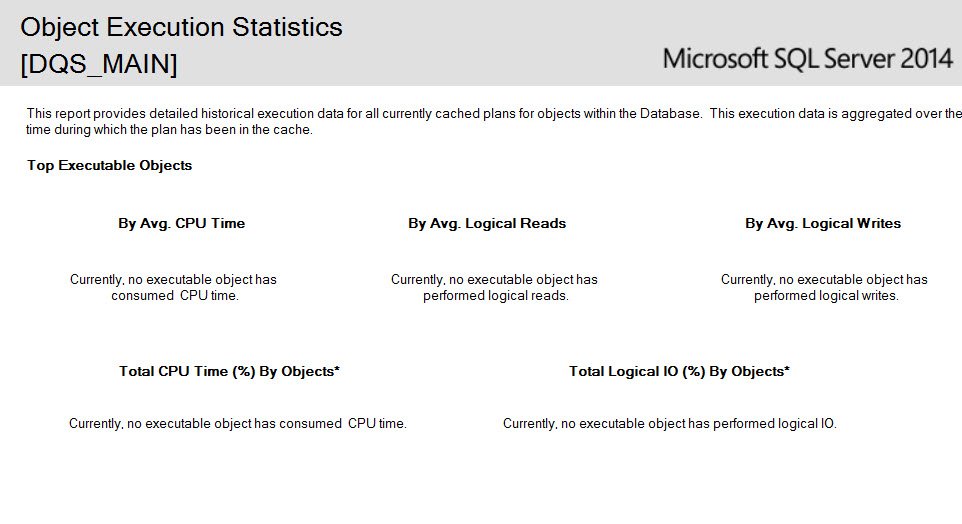
This is one of the interesting report which shows information about the execution of objects in the database. If we launch this report for a database which is not used and plans for any object, stored procedure, function etc. is not available in plan cache then we would see “empty” report like below.

There are five graphs available in the report. All of them are taken from the information available in DMV sys.dm_exec_query_stats which contains historical information about query executions since it was started. If plan is evicted from the cache then the report would not show the query which might be a problem.
To show some data in report, I have executed some stored procedures and functions in AdventureWorks2014 sample database. Here is the report when we have plans available in cache. This is what you would see on production server.

You would notice that out of 5 graphs only 3 are shown. That’s due to the fact that they are not significant higher and would be shown as zero.
Under the cover, it runs below query. I have modified query a little bit to show meaningful column name.
SELECT CASE WHEN sch.name IS NULL THEN '' ELSE sch.name END AS schema_name
, dense_rank() OVER (ORDER BY s2.objectid) AS SPRank
, s3.name AS [Obj Name]
, s3.TYPE AS [Obj Type]
, (SELECT TOP 1 SUBSTRING(TEXT,(s1.statement_start_offset+2)/2,
(CASE WHEN s1.statement_end_offset = -1 THEN LEN(CONVERT(NVARCHAR(MAX),TEXT))*2
ELSE s1.statement_end_offset END - s1.statement_start_offset) /2)
FROM sys.dm_exec_sql_text(s1.sql_handle)) AS [SQL Statement]
, execution_count
, plan_generation_num
, last_execution_time
, ((total_worker_time+0.0)/execution_count)/1000 AS [avg_worker_time]
, total_worker_time/1000.0 'total_worker_time'
, last_worker_time/1000.0 'last_worker_time'
, min_worker_time/1000.0 'min_worker_time'
, max_worker_time/1000.0 'max_worker_time'
, ((total_logical_reads+0.0)/execution_count) AS [avg_logical_reads]
, total_logical_reads
, last_logical_reads
, min_logical_reads
, max_logical_reads
, ((total_logical_writes+0.0)/execution_count) AS [avg_logical_writes]
, total_logical_writes
, last_logical_writes
, min_logical_writes
, max_logical_writes
, ((total_logical_writes+0.0)/execution_count +
(total_logical_reads+0.0)/execution_count) AS [avg_logical_IO]
, total_logical_writes + total_logical_reads 'Total IO'
, last_logical_writes +last_logical_reads 'Last IO'
, min_logical_writes +min_logical_reads 'Min IO'
, max_logical_writes + max_logical_reads 'MAX IO'
FROM sys.dm_exec_query_stats s1
CROSS apply sys.dm_exec_sql_text(sql_handle) AS s2
INNER JOIN sys.objects s3 ON ( s2.objectid = s3.OBJECT_ID)
LEFT OUTER JOIN sys.schemas sch ON(s3.schema_id = sch.schema_id)
WHERE s2.dbid = DB_ID()
ORDER BY s3.name;
This query would give the results for the database in which it would execute. Notice that there is a filter for db_id() in where clause. In the graph, we can observed object # assigned which is detailed in the table shown below the graph under heading “All Executable Objects”
If we click on (+) sign near Object No column, we can see more details about individual statement in the object. In below image, I have clicked on the (+) symbols near 2 and we can see statement within the function. You would see more rows if there are more statements in the procedure.
Reference: Pinal Dave (https://blog.sqlauthority.com)


3 Comments. Leave new
I ran across this blog post while searching for a rather elusive issue and was wondering if you had any insight. When running the “Resource Locking Statistics by Objects” report for a database on my SQL Server 2014, is shows “#Error” under the Lock Owner Type column. I can not for the life of me find any info on what that is or what causes it. Sometimes it’s listed once, sometimes it’s listed many times, and sometimes it’s listed many many times. Any ideas, clues, or hard facts would be greatly appreciated. I have a screen snippet if it’s helpful.
I am also facing same issue as above, are you able to fix above issue? If yes, please share me the solution
Pinal, thanks for providing the ObjExecStats query!
Your version is query-level, which is great, but I needed the object summary as well to find good candidates for query/index tuning.
I’ve found that the query exec count cross referenced with object CPU% and IO% (plus familiarity with user demand patterns) lets me target my efforts as areas of greatest impact.
For example, I found a relatively fast query (<1ms) at the core of our product that was not properly using a table PK. Correcting the issue reduced CPU demand by 75%, because this proc is executed roughly two orders of magnitude more frequenlty than any other object. I wouldn't have found it if the data wasn't expressed as a percentage of total demand.
By contrast, I've targeted procs with high % marks, only to discover that the stats were based on too few executions, due to plan cache resets or infrequent useage. Relative demand alone can't tell you if you're wasting your time.
So using your query as a starting point, I recreated the object-level of the report as a View that I think I will end up using all the time. One thing I'd like to add is object-level exec count, but I didn't spend time looking for it.
Please enjoy and share!
GO
Create View D1Dev_ViewObjExecStats
AS
— cte aggs ungrouped CPU and IO for % calc
with cte as(
Select
sum(s.[total_worker_time] / 1000.0) as [Tot_CPU_ms],
sum((s.[total_logical_reads] + s.[total_logical_writes]) / 1000.0) as [Tot_IO_ms]
From sys.dm_exec_query_stats s
cross apply sys.dm_exec_sql_text(sql_handle) as t
inner join sys.objects o on (t.objectid = o.object_id)
Where t.dbid = db_id()
)
Select
o.[object_id] as [ID],
o.[name] as [Name],
o.[type] as [Type],
convert(decimal(18, 2), round(sum(((s.[total_worker_time] + 0.0) / s.[execution_count]) / 1000), 2)) as [Avg_CPU_ms],
convert(decimal(18, 2), round(sum(s.[total_worker_time] / 10.0) / cte.[Tot_CPU_ms], 2)) as [Tot_CPU_%],
convert(decimal(18, 2), round(sum(((s.[total_logical_reads] + 0.0) / s.[execution_count])), 2)) as [Avg_Log_Reads],
convert(decimal(18, 2), round(sum(((s.[total_logical_writes] + 0.0) / s.[execution_count])), 2)) as [Avg_Log_Writes],
convert(decimal(18, 2), round(sum((((s.[total_logical_writes] + 0.0) / s.[execution_count]) + ((s.[total_logical_reads] + 0.0) / s.[execution_count]))), 2)) as [Avg_Log_IO],
convert(decimal(18, 2), round(sum((s.[total_logical_reads] + s.[total_logical_writes]) / 10.0) / cte.[Tot_IO_ms], 2)) as [Tot_Log_IO_%]
From sys.dm_exec_query_stats s
cross apply sys.dm_exec_sql_text(sql_handle) t
inner join sys.objects o on (t.objectid = o.object_id)
cross apply cte
Where t.[dbid] = db_id()
Group by o.[object_id], o.[name], o.[type], cte.[Tot_CPU_ms], cte.[Tot_IO_ms]
GO
select * from D1Dev_ViewObjExecStats