Introduction
SQL Server Profiler is a powerful tool that is available with SQL Server since a long time; however, it has mostly been underutilized by DBAs. SQL Server Profiler can perform various significant functions such as tracing what is running under the SQL Server Engine’s hood, and finding out how queries are resolved internally and what scripts are running to accomplish any T-SQL command. The major functions this tool can perform have been listed below:
- Creating trace
- Watching trace
- Storing trace
- Replaying trace
Trace includes all the T-SQL scripts that run simultaneously on SQL Server. As trace contains all the T-SQL scripts running on SQL Server, it often tends to become considerably huge. Hence, it is always a good practice to capture only those data that are actually required for analysis.
Dilemma to use on Production Server
SQL Server Profiler has a lot of potential as a tool and offers several advantages. Unfortunately, developers have been keeping their hands off from this tool and usually give two major excuses.
- Reason 1: Profiler adds too much overhead to production server.
- Reason 2: Profiler accumulates plethora of data making it extremely intricate to analyze them afterwards.
It cannot be denied that both the above excuses are valid reasons and play a significant role in discouraging developers from using the profiler. When a profiler is run over a production server it adds additional load on the CPU. However, the real question is – How much load does the profiler add to CPU? It may be possible that the production server’s CPU is not used more than 50% at all, and running the profiler over that database will not degrade the performance.
If the profiler is configured appropriately to trace only relevant data for analysis, it will diminish the additional load that is introduced while it is running. If the profiler is run for a longer duration, then to capture the event of longer duration it is very important to collect selective data, otherwise the collected data can outgrow the space on the server.
Profiler Terminology
It is important to understand profiler terminology before digging into its details and finding how it works.
Event – An event is an action within an instance of SQL Server Database Engine. Some good examples of event are running any T-SQL or performing any operation in the SSMS that is related to database; running stored procedures, and creating jobs.
Event Class – An event class can be defined as a type of event that can be traced. Examples of event classes are SP:Starting and RPC:Completed.
Event Category – Group of events are called an event category. Examples of event category are Stored Procedure and Locks. In fact, there can be multiple event categories that can be selected for single trace.
Data Column – Data column is an attribute of an event class captured in the trace. Data column contains value of an event class.
Filter –Filters are used to create selectiveness in data that are collected in trace.
Trace – A trace captures data based on the selected event classes, data columns, and filters. A trace devoid of filter can be very hefty. Columns that are indispensable for the analysis should be selected only in trace. Trace can be saved in the database as well as in trace files.
Template – A template defines the default configuration for a trace. Templates can be saved, imported and exported between SQL Server instances. Templates from one SQL Server version cannot be imported to a different SQL Server version. SQL Server 2009 comes with 9 pre-created templates. The default template is a standard template that captures all SP and T-SQL batches. It additionally logs general database server activity.
Some very basic examples are presented below where data has been captured.
Starting the Profiler
SQL Server profiler is a component of client tools and can be installed independently from SQL Server Database Engine. It is mandatory for the user to have “system admin” rights to start the profiler. It can be started using the following methods.
1. Going to Start >> All Programs >> Microsoft SQL Server 2008 >> Performance Tools >> SQL Server Profiler

2. From SQL Server Management Studio >> Go to Tools >> SQL Server Profiler

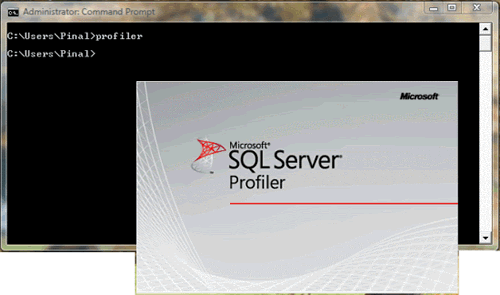
3. For SQL Server 2008, type profiler in the command prompt.
4. For SQL Server 2005, type profiler90 in the command prompt.
Collecting Data
Once the profiler is started, connect it to any database. As discussed earlier, a profiler is not restricted to connecting only to the local database. With appropriate authentication and system admin role, it can connect to any database and capture the data.
Once the profiler is started click on Menu >> File >> New Trace.

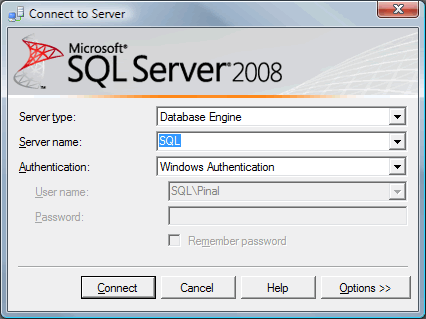
This will display a login prompt very similar to SQL Server Database Engine. Connect with the appropriate username and password.
It will display the ‘Trace Properties’ screen. On this screen you can enter the trace name. You will notice that trace provider name, type and versions are pre-populated and cannot be altered. These are set based on which SQL Server instance you are connected with.

The ‘Trace Properties’ screen contains a drop-down for template selection, which is labeled with ‘Use the template’. As mentioned earlier, the default template selected is standard. We can see what events are included in the Standard template in the next tab, ‘Events Selection’.
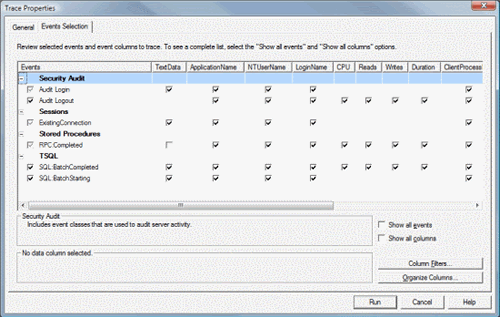
The ‘Event selection’ screen contains a checkbox that can be configured as per the requirement of data to be collected. The same screen contains a ‘Column Filters’ button, which when clicked brings up another screen that can be used to further filter trace data.
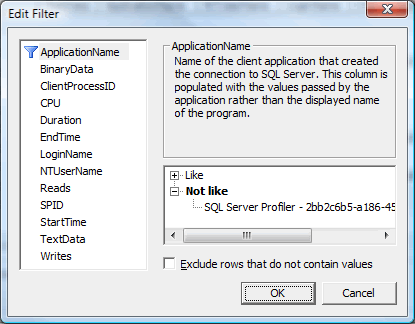
There is another button named ‘Organize Columns’ on the same screen. This screen can be used to organize and group columns. Please note that columns cannot be grouped or ordered once the process of trace collection has begun.

The ‘Trace Properties’ screen contains a ‘Run’ button. When you click on this button, it runs the trace. The trace can be paused or stopped as required using the play menu on top.
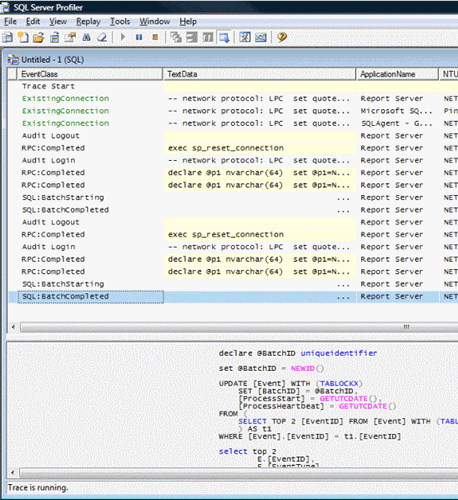
This data can be saved in database and trace file or saved as XML. Trace file can be imported back in profiler, and profiler can re-run the whole scenario. Once the trace file is saved in database table, it can be queried by using T-SQL.
Summary
This article is a prologue to SQL Server Profiler. In the next article, I will talk about filtering and organizing columns. In addition, I will include storing trace file in the database table and querying table.
Please write to me at pinal@sqlauthority.com or contact me using form on my blog https://blog.sqlauthority.com/ if you have any doubt, big or small, regarding this article.
Reference : Pinal Dave (https://blog.sqlauthority.com), DotNetSlackers


43 Comments. Leave new
Hi Pinal,
Good one, I have found SQL Profiler to be very useful, used it in OLTP,SSRS environments a lot. I was recently introduced to SQL Server Profiler events which were specific to Analysis services, apparently these can be used to figure out How cube caches data and also check out performance of the cube. In the initial drop down for server type one would choose analysis services.
Really Really Nice post…..
As pinal said, traces are good and bad. They are good and useful if used correctly and they can be very bad if not correctly used.
I was playing with a SQL Server monitoring tool recently (to check the health of one of the servers) and the tool installed a trace silently, and gave us some trouble. I think the problem was that it installed a trace that captured ALL the events/activities and that added quite a lot of load on the server.
So it is very important that when running a trace on a production server, you need to make sure that only those events that are ‘necessary’ are captured in your trace.
you are a Champion Jacob. I love your sql knowledge, it is awesome. Keep up the good work man.
Cheers,
Chandru.
In template definition, you mentioned “SQL Server 2009”
Did I read it correct or it’s a typo.
Hello sir,
Nice post thanks
thanks sir,
you are doing a great job.thanks once again for your information.
Good name Sukhmeet. I am Sukh. Hope, you could be meet! :)
Nice work pinal dave..your all artical is really good..
Hi Sir,
I read your blog re Introduction to SQL Profiler 2008.
Our database (MS SQL 2000) will be migrated to (MS SQL 2008) soon. However, we wont be given a SA account or SA access so we might not be able to utilize SQL 2008 profiler. Is there a way around this? the SQL Profiler helps developers like me.
Any help will be greatly appreciated.
Thanks
Hi Alex,
Looks like to run the profiler you don’t need System Admin however ensure profiler is installed correctly. I donot have SA access but still i am able to access profiler without any issues.
Nice Article, it will help a lot to understanding the Sql Profiler.
very good article :)
Simply Superb!!
hi pinal,
We have created a trace file and default trace as well on production Server MSSQL2005 but when the services are restarted automatically trace gets disable. How to enable trace file permanently even if services are restarted. Kindly explain.
thanks in advance
Can anyone say, how to use profiler from local machine, when application is actually launched and running from server. For such application SessionID on local machine remains 0 and I have checked for other filters like processID but that is also not working. I am running my desktop application which is actually launched from server and application instance is created on my local machine. I want to trace queries running from my application only, please help me
Thanks in advance
Hi,
I have a question about reading the trace table.
When I have gathered trace information in a table , how can I generate report on it?
for example I want to analyze queries by group etc
this is nice as a starter; very clear and the fact that you say there is more to read makes it more comprehensive as well
sql server 2008 profiler.exe not start error having the application failed to initialize properly (0xc000007b)
One question.
I try to connect to a ssas cube using a C3 code fdorm another machine , – all on same domain. In the profiler i find the username as administrator, irrespective of the content of the userid in conncetion string? Is it possible to connect to the SSAS using the userid proivded in the connection string and the same userid getting reflected in the sql profiler as well.
Hi Pinal,
I have question around Column filters in SQL Server Profiler- Application Name like ‘SSIS-Package’ does not result any thing, as its looking for exact match? How do i write Like ‘%SSIS-Package%’ filter
Hi Pinal,
From where the profiler reads data. Is it log file or Sql engine?
Can you just point me to some link on this.
Really fantastic.