

A query runs fine in test but slow in production? SQL Server 2016 tools add a way of comparing execution plans so you can find what changed.
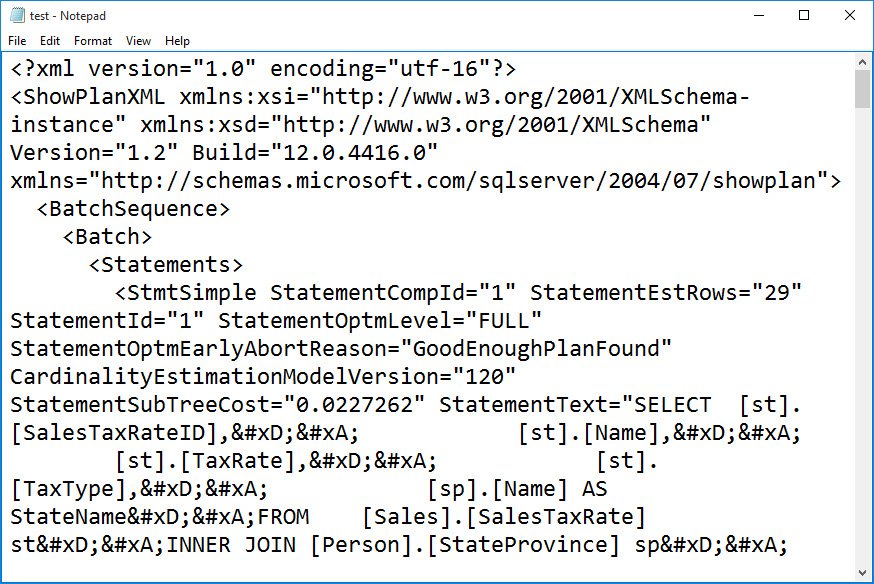
SQL SERVER – Save and Send Execution Plan Via Email
A reader wanted to send a big graphical execution plan via email to a friend. Here is a quick step by step way to save it, and what to do if it is over 20 MB.

Plan Guides: Fixing a Query You Cannot Change
Apply plan guides to a parameterized query you cannot edit, validate the guide, confirm plan matching, and compare Query Store hints.

SQL SERVER – Script: Finding queries without JOIN Predicates
During a code review I spotted a query missing its join condition. Here is a script for finding queries without JOIN predicates in SQL Server.

Analysis Services Performance Monitoring: What to Measure
Analysis Services performance monitoring starts with one habit: take measurements before users complain. This guest post by Bill Anton explains what to measure for processing and for queries, and why the OLAPQueryLog table tells only part of the story.

How to Find Queries Running in Parallel in SQL Server
To find queries running in parallel, read max_dop and the CPU to elapsed ratio from the query stats view, then confirm with the plan XML. This post tests both on a two million row table. It also explains why the same query stays serial until its cost passes the threshold.
SQL SERVER – Querying Performance Counters from SQL Server
When SQL Server is slow, where do you start? I look at querying performance counters from inside SQL Server as a quick way to see what is going on.