Cost relative to the batch is a share, not a score, so a batch with one query always shows 100%. The number says how the statements of a batch divide the estimated cost. It does not say that a query is expensive.

What the Percent Means
Management Studio prints a line above each plan: Query cost (relative to the batch). SQL Server estimates a cost for each statement. Management Studio adds the estimates of the batch and shows each statement as a share of the total. One statement is the whole total, so it is 100%.
The cost relative to the batch has a trap. It compares statements only inside one batch. Two batches with 100% each can differ by any factor in real cost. A common question asks how to bring a query that shows 100% down. You cannot, and you do not need to. The percent is a share, and with one statement the share is the whole batch.
The demo builds a database named QueryCostDemo with 100,000 orders. Run the scripts on a test server.
IF DB_ID(N'QueryCostDemo') IS NULL CREATE DATABASE QueryCostDemo;
GO
USE QueryCostDemo;
GO
DROP TABLE IF EXISTS dbo.CostOrders;
CREATE TABLE dbo.CostOrders (
    OrderID    int           NOT NULL PRIMARY KEY,
    CustomerID int           NOT NULL,
    Amount     decimal(10,2) NOT NULL,
    Note       char(80)      NOT NULL
);
WITH Numbers AS (
    SELECT TOP (100000) ROW_NUMBER() OVER (ORDER BY (SELECT NULL)) AS n
    FROM sys.all_objects AS a CROSS JOIN sys.all_objects AS b
)
INSERT INTO dbo.CostOrders (OrderID, CustomerID, Amount, Note)
SELECT n, n % 3000, n % 700 + 0.25, CONCAT('Order ', n % 977)
FROM Numbers;
A procedure then reproduces the percent. It finds the cached plan of a batch by a comment marker. It reads the estimated cost of each SELECT statement from the plan XML and divides it by the total. It also reads the elapsed time of each statement from the query statistics. That lets you compare the estimate with the clock. The procedure reads SELECT statements only, so use it on a batch that holds nothing else. Management Studio counts every statement.
CREATE OR ALTER PROCEDURE dbo.ShowBatchCost @Marker nvarchar(40)
AS
BEGIN
    SET NOCOUNT ON;
    DECLARE @Pattern nvarchar(60) = N'%' + @Marker + N'%';
    SELECT TOP (1) qs.plan_handle
    INTO #Batch
    FROM sys.dm_exec_query_stats AS qs
    CROSS APPLY sys.dm_exec_sql_text(qs.sql_handle) AS st
    WHERE st.text LIKE @Pattern AND st.text NOT LIKE N'%dm_exec%'
    ORDER BY qs.last_execution_time DESC;
    WITH XMLNAMESPACES (DEFAULT 'http://schemas.microsoft.com/sqlserver/2004/07/showplan'),
    Statements AS (
        SELECT b.plan_handle,
               s.n.value('@StatementId', 'int') AS StatementNo,
               s.n.value('@StatementSubTreeCost', 'float') AS EstimatedCost
        FROM #Batch AS b
        CROSS APPLY sys.dm_exec_query_plan(b.plan_handle) AS q
        CROSS APPLY q.query_plan.nodes('//StmtSimple') AS s(n)
        WHERE s.n.value('@StatementType', 'nvarchar(20)') = N'SELECT'
    )
    SELECT s.StatementNo,
           CAST(ROUND(s.EstimatedCost, 3) AS decimal(10,3)) AS EstimatedCost,
           CAST(100.0 * s.EstimatedCost / SUM(s.EstimatedCost) OVER () AS decimal(5,1)) AS EstimatedPercent,
           qs.last_elapsed_time / 1000 AS ElapsedMs,
           CAST(100.0 * qs.last_elapsed_time / SUM(qs.last_elapsed_time) OVER () AS decimal(5,1)) AS ElapsedPercent
    FROM Statements AS s
    JOIN (SELECT plan_handle, last_elapsed_time,
                 ROW_NUMBER() OVER (PARTITION BY plan_handle ORDER BY statement_start_offset) AS StatementNo
          FROM sys.dm_exec_query_stats) AS qs
         ON qs.plan_handle = s.plan_handle AND qs.StatementNo = s.StatementNo
    ORDER BY s.StatementNo;
END;
One Query Is Always 100%
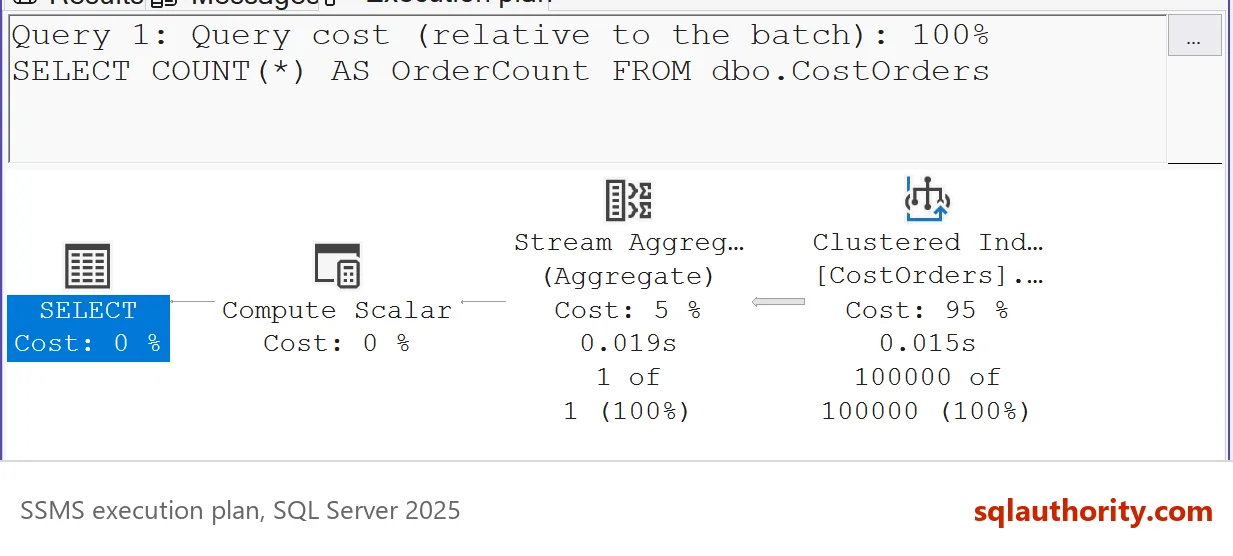
The first batch has one statement. The marker comment lets the procedure find it.
/* CostDemoSingle */
SELECT COUNT(*) AS OrderCount FROM dbo.CostOrders;
EXEC dbo.ShowBatchCost @Marker = N'CostDemoSingle';
| StatementNo | EstimatedCost | EstimatedPercent | ElapsedMs | ElapsedPercent |
|---|---|---|---|---|
| 1 | 1.147 | 100.0 | 9 | 100.0 |
The only statement has an estimated cost of 1.147, which is 100% of 1.147. That is the whole mystery. The query is neither good nor bad. It is alone.
A Batch Divides the Cost
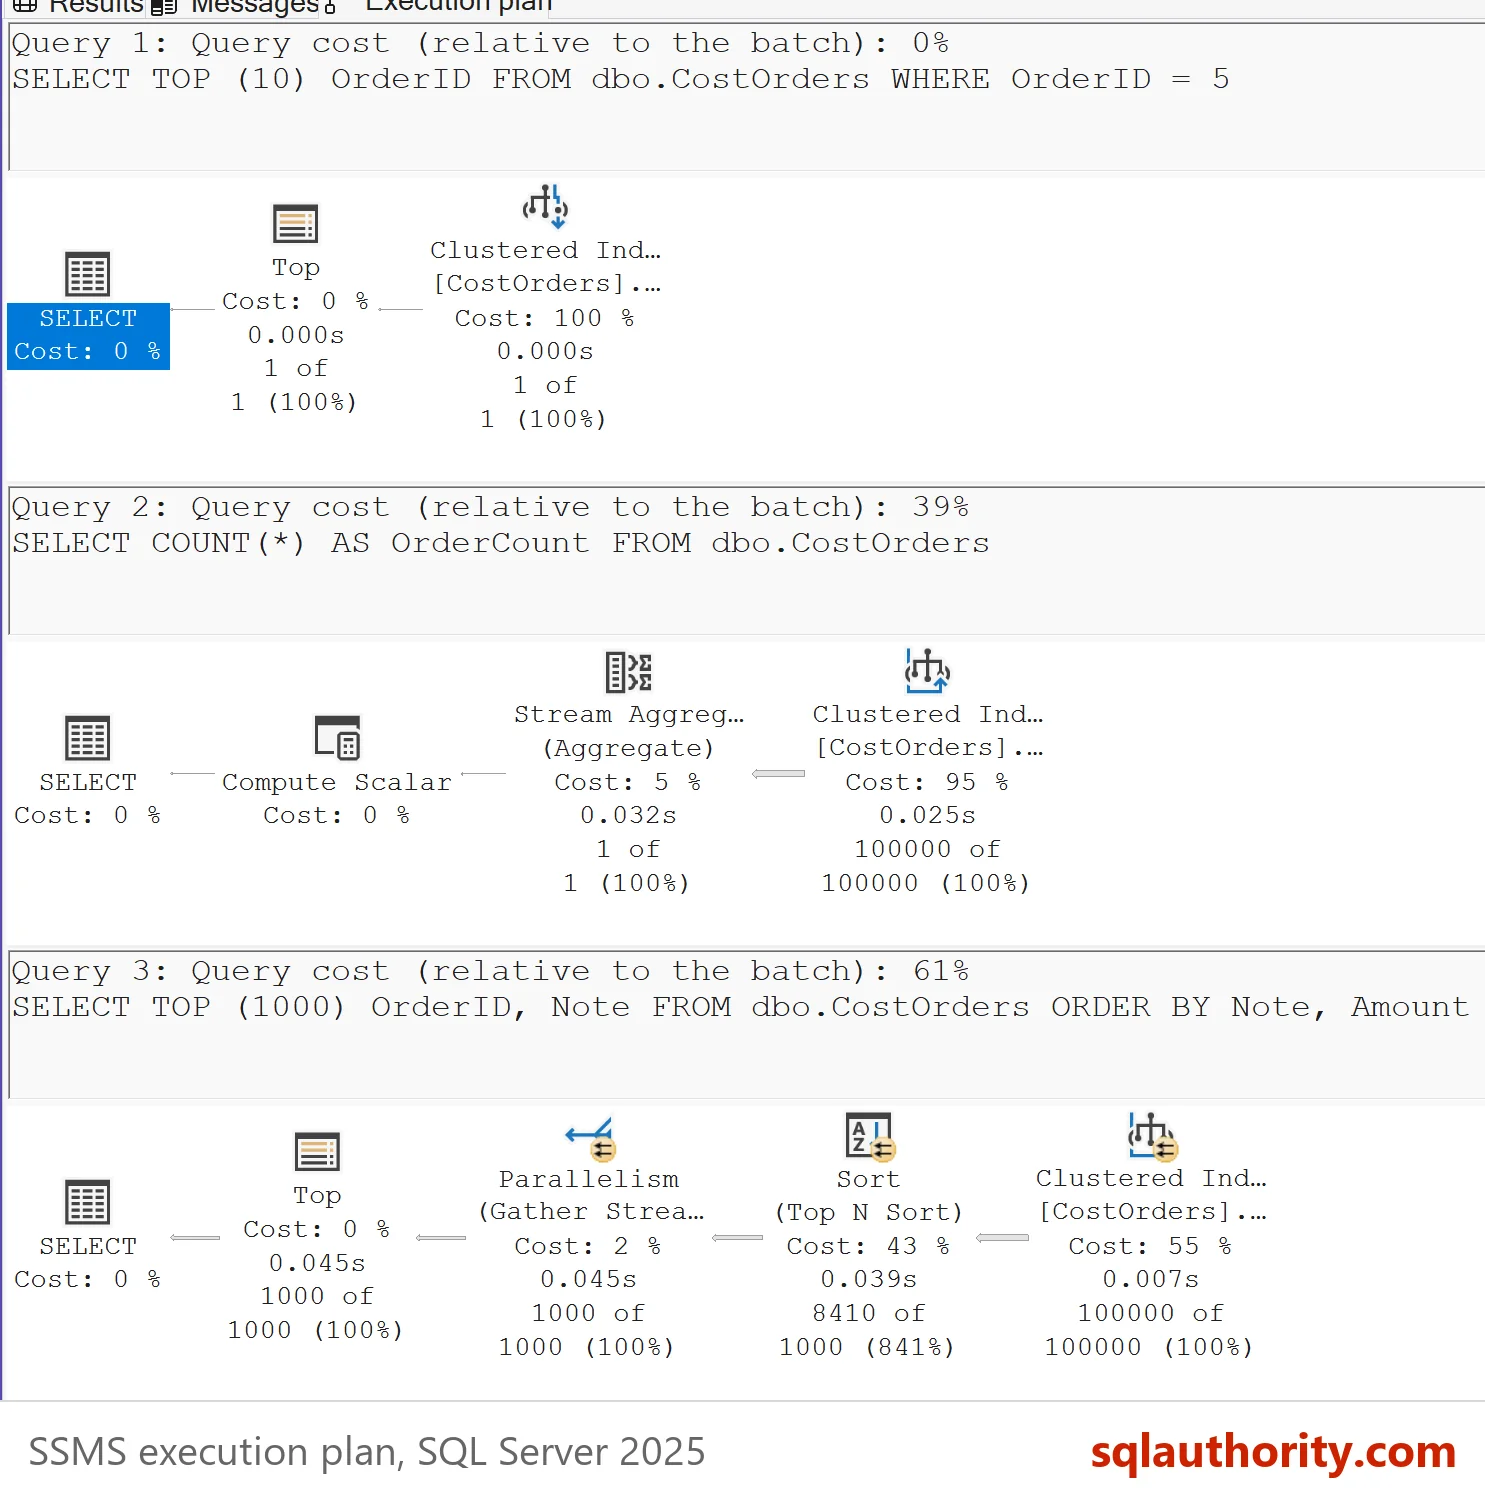
The second batch holds three statements. The first reads one row by key. The second counts all rows. The third sorts the table by two columns.
/* CostDemoMulti */
SELECT TOP (10) OrderID FROM dbo.CostOrders WHERE OrderID = 5;
SELECT COUNT(*) AS OrderCount FROM dbo.CostOrders;
SELECT TOP (1000) OrderID, Note FROM dbo.CostOrders ORDER BY Note, Amount;
EXEC dbo.ShowBatchCost @Marker = N'CostDemoMulti';
| StatementNo | EstimatedCost | EstimatedPercent | ElapsedMs | ElapsedPercent |
|---|---|---|---|---|
| 1 | 0.003 | 0.0 | 0 | 0.0 |
| 2 | 1.147 | 11.6 | 9 | 4.9 |
| 3 | 8.723 | 88.3 | 191 | 95.1 |
Now the percent means something. The sort has 88.3% of the estimated cost and used 95.1% of the elapsed time. The one-row lookup shows 0.0%. When two statements show 0% and 100%, start with the 100% statement. The numbers above come from one run on my test server, and the milliseconds change a little each time. A second server gave the sort a smaller share of the batch, about 61%, and it was still the largest.
When the Percent Misleads
You should not trust the percent alone, because it comes from estimates. Some work does not appear in the estimate. A scalar function that SQL Server cannot inline is the classic case. A WHILE loop in the function body blocks inlining. The estimate then counts the call but not the loop inside it.
The function below does nothing useful. It loops 100 times and returns twice its input. The batch after it runs a cheap scan, then calls the function for 20,000 rows.
CREATE OR ALTER FUNCTION dbo.SlowDouble (@Value int)
RETURNS int
AS
BEGIN
    DECLARE @Counter int = 0;
    WHILE @Counter < 100 SET @Counter += 1;
    RETURN @Value * 2;
END;
/* CostDemoUdf */ SELECT COUNT(*) AS OrderCount FROM dbo.CostOrders; SELECT SUM(dbo.SlowDouble(OrderID)) AS Doubled FROM dbo.CostOrders WHERE OrderID <= 20000;
EXEC dbo.ShowBatchCost @Marker = N'CostDemoUdf';
| StatementNo | EstimatedCost | EstimatedPercent | ElapsedMs | ElapsedPercent |
|---|---|---|---|---|
| 1 | 1.147 | 83.2 | 9 | 0.6 |
| 2 | 0.232 | 16.8 | 1605 | 99.4 |
The estimate says the scan is 83.2% of the batch. The clock says the function call took 99.4% of it, 1,605 milliseconds against 9. These milliseconds change from run to run too. Alone in a batch, either statement would show 100%, although one took 9 milliseconds and the other 1,605. The plan shows only a small cost for the function, so the percent points at the wrong statement.
You could argue that the percent still helps. The sort in the earlier batch had the largest estimate and the longest run. That is true when the estimates are good. It stops being true when the work hides inside something the estimate cannot see. Check the clock before you act on the share.
What to Check Instead
Use the actual plan, not the estimated one. Compare the actual row counts with the estimated ones on every operator. A large gap means the estimate was wrong, and so is the percent. Add SET STATISTICS TIME ON and SET STATISTICS IO ON to see the real time and reads of each statement.
For a long history, look at the runtime statistics in Query Store. They hold real durations, not estimates. A statement is worth tuning when its actual time and reads are large, whatever share it shows.
What to Remember
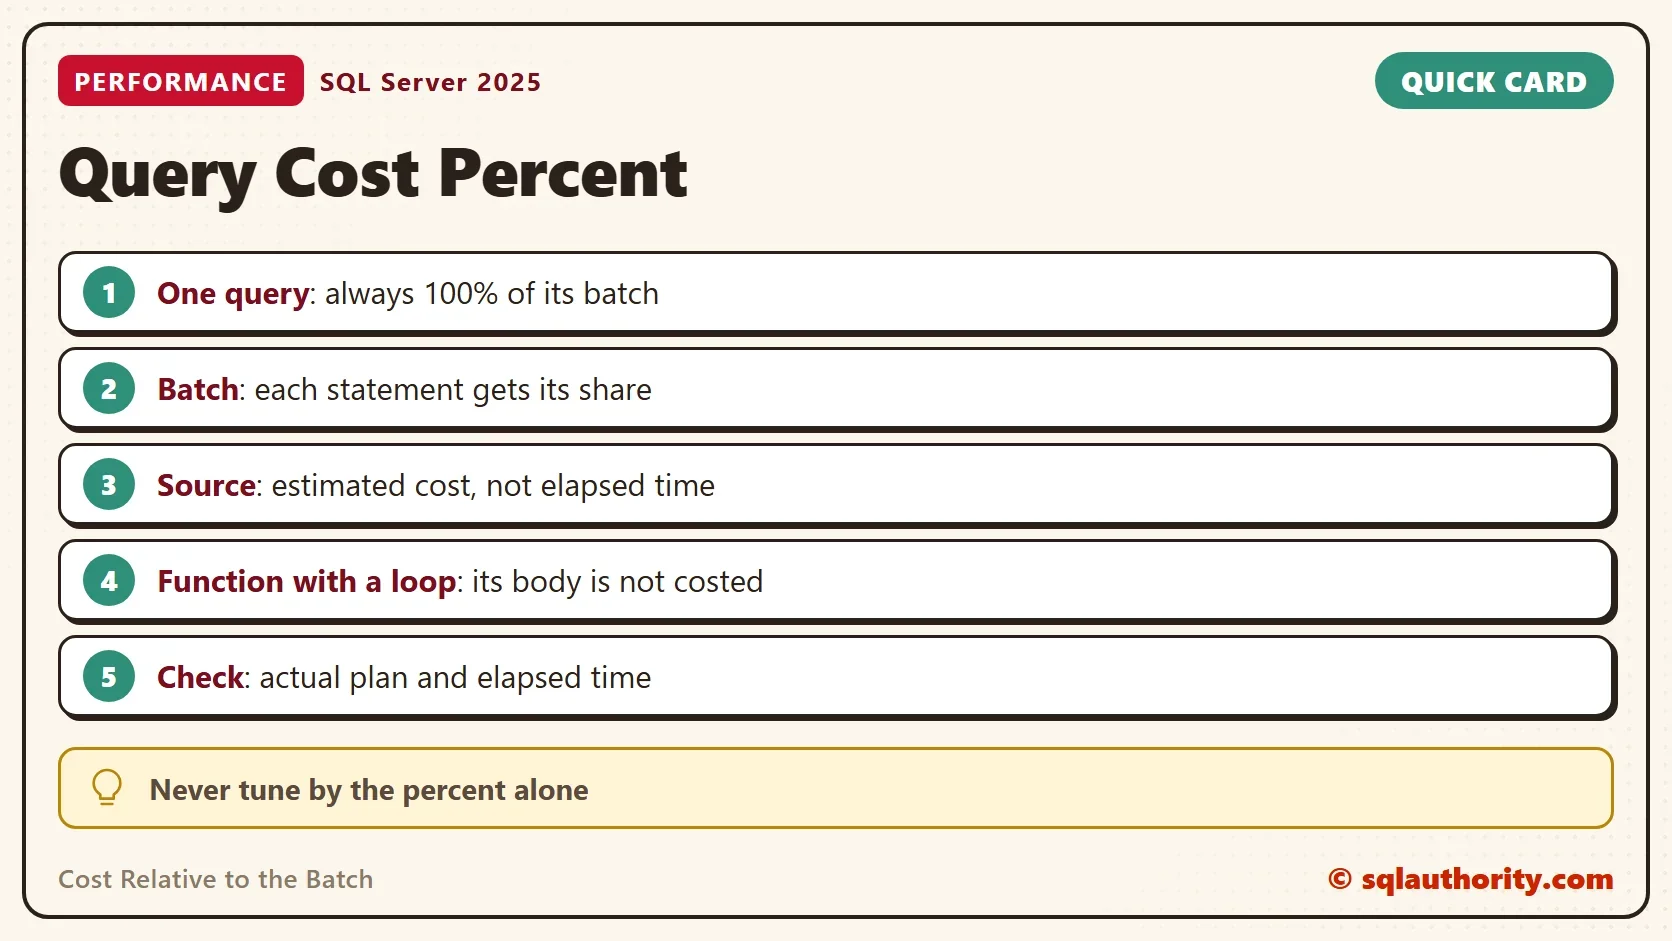
The cost relative to the batch is a share of estimated cost. A single query shows 100% because it is the whole batch. Read the share as a hint about where to look first. Confirm it with the actual plan and the elapsed time. When you finish with the demo, remove the database.
USE master;
GO
DROP DATABASE QueryCostDemo;
A 100% cost is not a warning, it is a batch with one statement.
Published by Pinal Dave on SQLAuthority. More of my work at pinaldave.com.
Discover more from SQL Authority with Pinal Dave
Subscribe to get the latest posts sent to your email.