SQL Server Performance Tuning is what I do for leaving and every single day, I get different problems to solve. Just another day I was hired for just 1 hour to solve one specific problem of my client with whom I had worked on Comprehensive Database Performance Health Check. This time I was able to help them with Query Specific Wait Statistics.
Sudden Slow Query
As I had previously worked with this client we had fixed pretty much every single avenue which can leak the performance for the client. We had worked extremely comprehensively to solve their performance problems. When they called me, I was expecting that their issue will be very complex.
However, the recent issue was very much common. They had one particular query which was earlier running very quickly suddenly started to run slow but all other queries were running at optimal speed.
Diagnosis – Lone Slow Query
During the investigation process, we figured out that all the other queries were running very fast but their one particular query was running very slow. This made things pretty simple for us. We spent some time to identify that one query and all the necessary parameters to run that query.
Once the query and parameters were available we tried many different tricks which are common in the performance tuning expert’s book to tune any slow running query. We were able to validate that there is no issue with parameter sniffing. Additionally, recompilation was also not helping our query.
We nearly spend 12 minutes in trying 8 different solutions to speed up the query but all attempts were in the vain.
Resolution of Query Specific Wait Statistics
Finally, I decided to run the query in the SSMS and check the query-specific wait statistics to know what is actually making the query very slow. As soon as I checked the SQL Wait Statistics for the query, I immediately realized why none of my previous attempts helped that one specific query.
The query which we were running needed a lot of memory and the server was running the query just fine as it had enough memory to run the query. In our case, the database which we were dealing with was 1.5 TB and server had over 512 GB of memory.
When I checked the wait statistics of the query, we realized that the query was really starving with the memory. Looking at the configuration of the server and past history of the query, we knew the memory was good enough for the query but still the wait statistics showed that as a problem.
Suddenly, I remembered that my other client had exactly the same problem a few weeks earlier and the resource governor was the culprit for the same. You can read about that here. I quickly checked on the server and found recently enabled resource governor. We disabled the resource governor and re-run query to see that our query ran amazingly fast as usual.
Query Specific Wait Statistics and SSMS
Now let us see how we can check Query Specific Wait Statistics with the help of SQL Server Management Studio (SSMS).
First, enable an actual execution plan for the query. Here is how you can enable the actual execution plan in SQL Server Management Studio (SSMS).
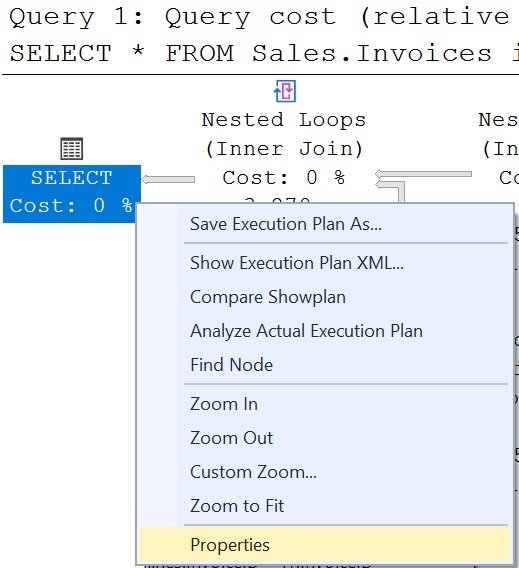
Next, run the query and right-click on the leftmost operator. In our case, we had the leftmost operator was a SELECT statement. On the right-click menu, there is an option to see the properties of the query.

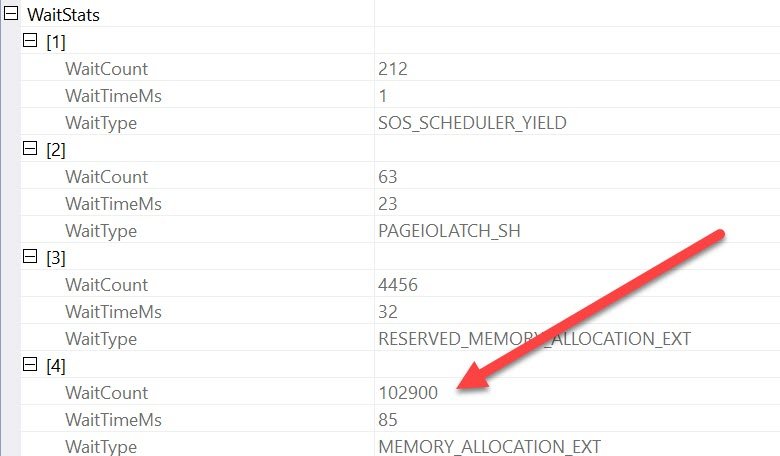
Once you open the properties bar in the SSMS, find the property WaitStats and expand in further. Over here you will see all the wait statistics related to the query.

In our case, we found that there was a very high amount of wait on Memory Allocation and that lead me to find the root cause of memory pressure.
Please note that in our case, it was due to Resource Governor as it was incorrectly configured. Once the performance was restored for the query and server was running at optimal speed. We once again enabled Resource Governor with optimal settings.
Comprehensive Database Performance Health Check
There are many such stories I often encounter while I work with various clients during Comprehensive Database Performance Health Check engagement. In the last 10 years, I think I have pretty much seen most of the problems which one can encounter. Let me know if you are facing SQL Server Performance problem, I would love to help you tune your server.
Reference: Pinal Dave (https://blog.sqlauthority.com)


