
sys.trace_events lists available SQL trace events rather than only default-trace collection. Readers asked after my creation-date article.

SELECT trace_event_id,category_id,name FROM sys.trace_events ORDER BY trace_event_id;
SELECT category_id,name,type FROM sys.trace_categories ORDER BY category_id;
DECLARE @TraceID int=(SELECT TOP (1) id FROM sys.traces WHERE is_default=1 ORDER BY id);
SELECT DISTINCT e.trace_event_id,e.name
FROM sys.fn_trace_geteventinfo(@TraceID) i JOIN sys.trace_events e ON e.trace_event_id=i.eventid
WHERE @TraceID IS NOT NULL ORDER BY e.trace_event_id;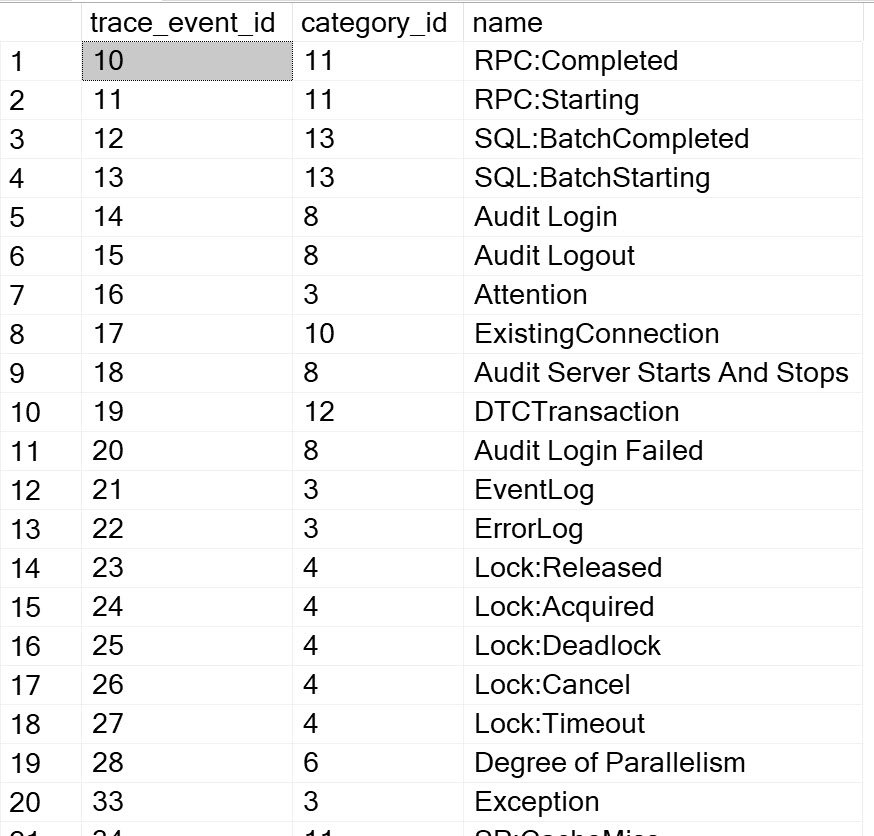
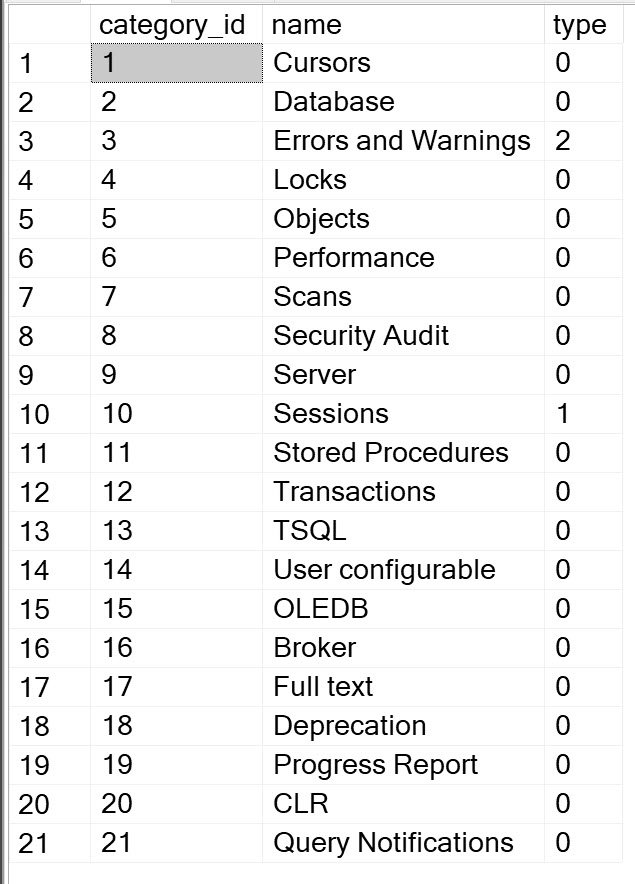
The earlier environment had 180 event definitions and 21 categories. Counts can vary by release. The additional query lists configured events for a present default trace. No active default trace means no useful configured-event list.
Catalog presence does not establish that an event was enabled or retained. Inspect collected data and its retention window. Use those records for incident evidence.
SQL Trace and Profiler are deprecated. Use Extended Events for new collection with relevant events and a suitable target. Measure collection overhead. These queries remain useful for older tooling and retained evidence.
Reference: Configured SQL Trace events.
Related reading
An event definition is not evidence that it occurred, it is a catalog entry separate from configured and retained collection.
Published by Pinal Dave on SQLAuthority. More of my work at pinaldave.com.
Discover more from SQL Authority with Pinal Dave
Subscribe to get the latest posts sent to your email.




1 Comment. Leave new
Thanks, Pinal. This is exactly what I needed! Love your tutorials. Very concise and easy to understand.