Execution plan wait stats show what one query waited for, so you can stop guessing from server-wide totals. Server wait statistics mix every session together. Execution plan wait stats belong to one execution of one statement.

Find the Wait Stats in an Actual Plan
You need an actual plan, because an estimated plan describes a query that never ran. In Management Studio, press Ctrl+M to switch on Include Actual Execution Plan, then run the query. Open the Execution Plan tab and click the first operator, the SELECT, INSERT, UPDATE or DELETE. Press F4 to open the Properties window and expand WaitStats. These steps follow the SSMS 22 menus.
Each row of WaitStats names a wait type, a wait count and the wait time in milliseconds. The same rows sit in the plan XML, so you can read them from a saved plan too. Recent versions of SQL Server write them. For other ways to capture the plan, read Actual Execution Plan in SQL Server: Graphical, Text and XML.
A Query That Waits on a Lock
A lock wait is easy to reproduce. The database is PlanWaitStatsDemo, with one small invoice table. The script also sets Query Store to capture every query in this database. The last section uses it, and the default mode skips cheap queries like this one.
IF DB_ID(N'PlanWaitStatsDemo') IS NULL CREATE DATABASE PlanWaitStatsDemo;
GO
USE PlanWaitStatsDemo;
GO
ALTER DATABASE PlanWaitStatsDemo SET QUERY_STORE = ON (QUERY_CAPTURE_MODE = ALL, WAIT_STATS_CAPTURE_MODE = ON);
DROP TABLE IF EXISTS dbo.Invoices;
CREATE TABLE dbo.Invoices (
    InvoiceID   int IDENTITY(1,1) NOT NULL PRIMARY KEY,
    CustomerID  int           NOT NULL,
    InvoiceDate date          NOT NULL,
    Total       decimal(10,2) NOT NULL
);
INSERT INTO dbo.Invoices (CustomerID, InvoiceDate, Total)
SELECT n % 300 + 1, DATEADD(DAY, n % 700, '2024-01-01'), n % 500 + 5.25
FROM (SELECT TOP (20000) ROW_NUMBER() OVER (ORDER BY (SELECT NULL)) AS n
      FROM sys.all_objects AS a CROSS JOIN sys.all_objects AS b) AS x;
This demo needs two query windows. In window 1, start a transaction that updates one row and holds its lock for six seconds. Then, within two seconds, run the query in window 2.
USE PlanWaitStatsDemo;
BEGIN TRANSACTION;
UPDATE dbo.Invoices SET Total = Total + 1 WHERE InvoiceID = 1;
WAITFOR DELAY '00:00:06';
ROLLBACK TRANSACTION;
Window 2 asks for the same row. With the actual plan switched on, its plan shows the wait. The script below prints the plan as XML instead, which carries the same information.
USE PlanWaitStatsDemo;
SET STATISTICS XML ON;
SELECT InvoiceID, CustomerID, Total FROM dbo.Invoices WHERE InvoiceID = 1;
SET STATISTICS XML OFF;
The query is blocked until window 1 rolls back. In the XML, the WaitStats block and the time statistics read like this. Your times differ, because they depend on when you start window 2.
<WaitStats>
  <Wait WaitType="LCK_M_S" WaitTimeMs="4448" WaitCount="1" />
</WaitStats>
<QueryTimeStats ElapsedTime="4448" CpuTime="0" />
Read the Numbers
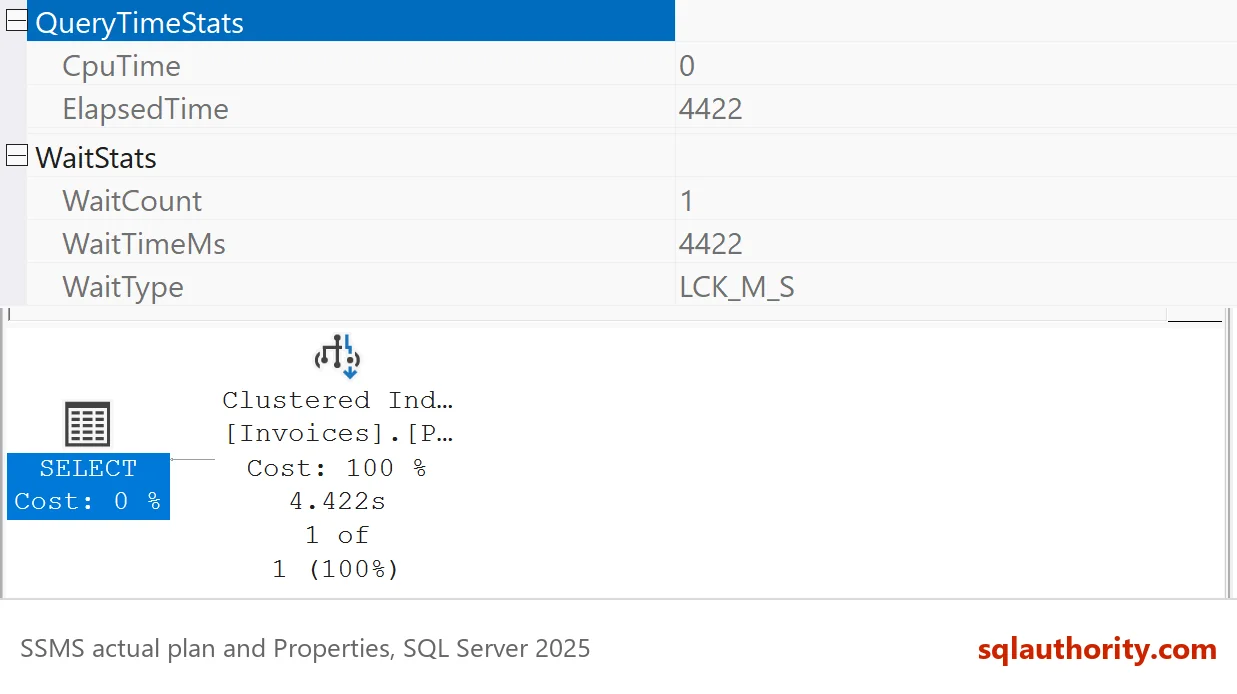
LCK_M_S is a shared lock wait. The query waited once, for 4,448 milliseconds. Look at the time statistics next to it. The elapsed time equals the wait time, and the CPU time is zero. The query did no work for most of its life. It was blocked. Tuning the query would change nothing, so the next step is to find the session that holds the lock. The picture comes from a second server, where the same wait took 4,422 milliseconds.
A query that did not wait has no WaitStats block. Three runs of a plain count over the same table, with nothing blocking it, produced none. An empty section means no wait was recorded, which is good news. When a block exists, match its wait types to a cause.
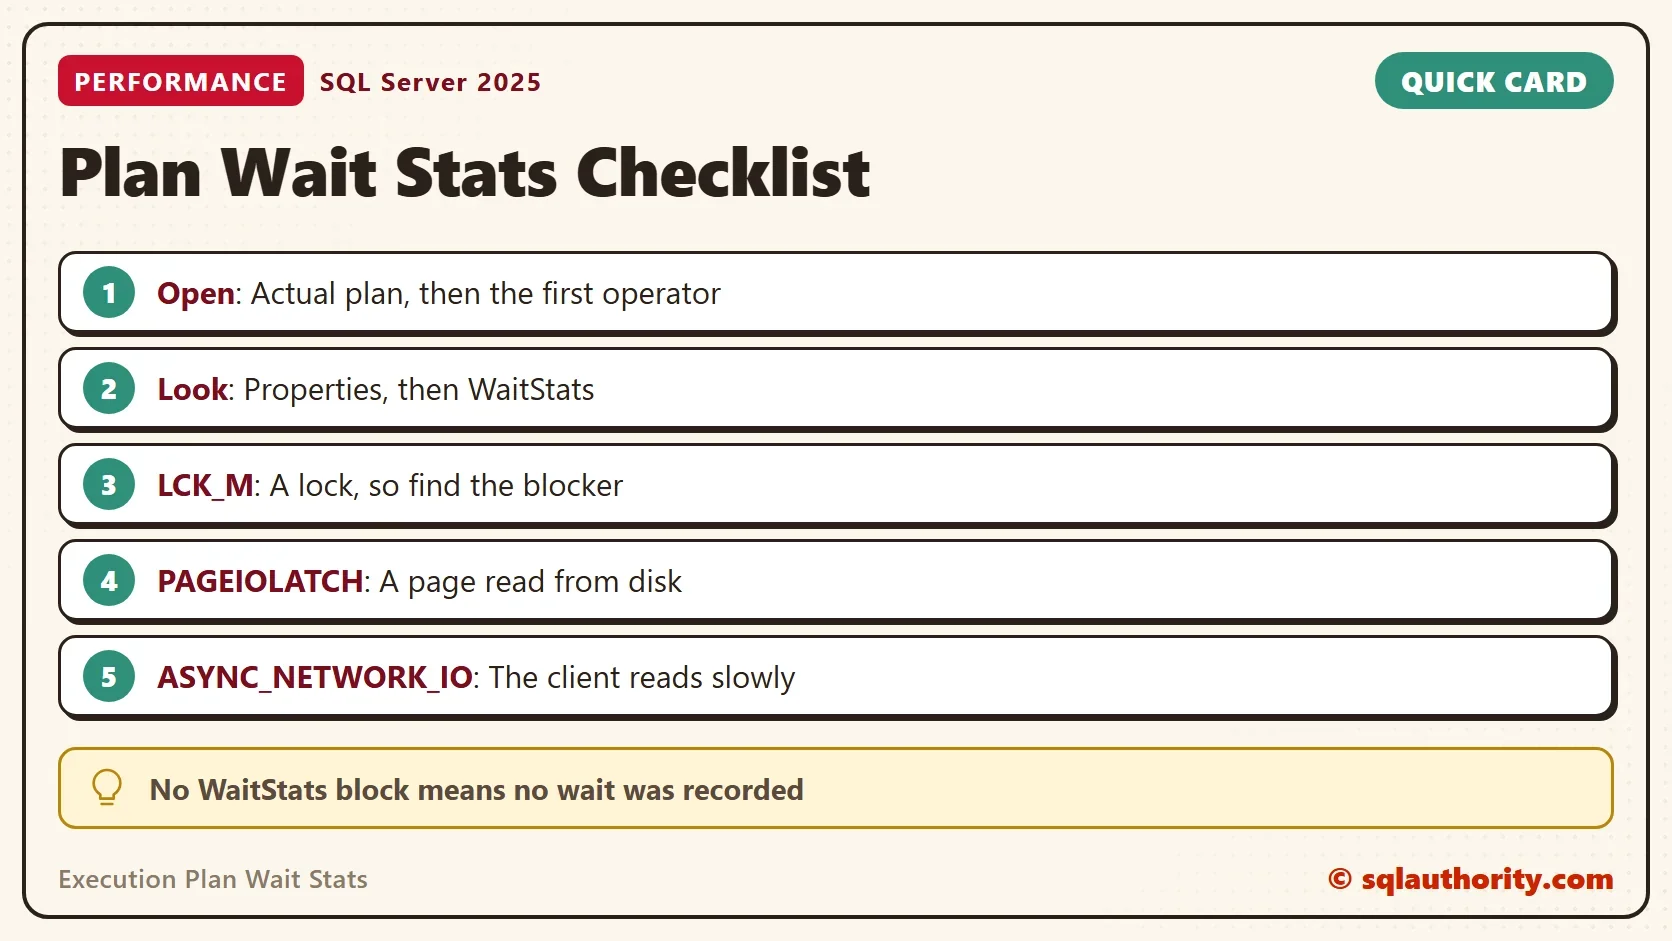
| Wait type | What the query waited for |
|---|---|
| LCK_M_S, LCK_M_X and similar | A lock held by another session |
| PAGEIOLATCH_SH | A data page read from disk |
| ASYNC_NETWORK_IO | The client to take the rows |
| SOS_SCHEDULER_YIELD | Another turn on the CPU |
| WRITELOG | The log flush at commit |
| RESOURCE_SEMAPHORE | A memory grant |
One Run Is Not Proof
You could argue that the plan hands you the answer. It hands you one execution. Run the query again and the same plan can show different waits, or none. A lock wait depends on who held the lock at that moment. A disk wait depends on what was in memory.
Treat execution plan wait stats as a clue, then check them. Repeat the query a few times, and compare the wait types with the server-wide totals. A wait that appears in the plan and in the server’s top waits is worth chasing. One that appears once needs a second run before you act.
Keep the Waits of Many Queries
A plan covers one execution that you caught. Query Store keeps wait totals per query and per category over time, with no plan to capture. This query lists the lock waits it recorded in the demo database. The flush call writes pending data to disk first, so the rows appear at once.
USE PlanWaitStatsDemo;
EXEC sys.sp_query_store_flush_db;
SELECT LEFT(qt.query_sql_text, 75) AS StatementStart, ws.wait_category_desc, ws.total_query_wait_time_ms
FROM sys.query_store_wait_stats AS ws
JOIN sys.query_store_plan AS p ON p.plan_id = ws.plan_id
JOIN sys.query_store_query AS q ON q.query_id = p.query_id
JOIN sys.query_store_query_text AS qt ON qt.query_text_id = q.query_text_id
WHERE ws.wait_category_desc = N'Lock'
ORDER BY ws.total_query_wait_time_ms DESC;
After the two window demo, the query returns one row.
| StatementStart | wait_category_desc | total_query_wait_time_ms |
|---|---|---|
| (@1 tinyint)SELECT [InvoiceID],[CustomerID],[Total] FROM [dbo].[Invoices] W | Lock | 4448 |
The blocked query appears with the Lock category. Its total equals the plan’s wait. Query Store groups waits into categories such as Lock, Buffer IO and Network IO. It tells you what kind of wait, and the plan tells you which one.
What to Remember
Open an actual plan, click the first operator and read WaitStats. Compare the elapsed time with the waits. If the waits explain most of it, tune the cause, not the query. If no block exists, the query didn’t wait, and CPU or reads are the next place to look.
Use execution plan wait stats for the one slow query in front of you, and Query Store for the pattern. When you finish testing, drop the example database.
USE master;
GO
ALTER DATABASE PlanWaitStatsDemo SET SINGLE_USER WITH ROLLBACK IMMEDIATE;
DROP DATABASE PlanWaitStatsDemo;
A slow query is not always a bad query, it is sometimes a query that is waiting.
Published by Pinal Dave on SQLAuthority. More of my work at pinaldave.com.
Discover more from SQL Authority with Pinal Dave
Subscribe to get the latest posts sent to your email.