
A fair test of row mode vs batch mode changes only the execution mode. A query hint does that at one compatibility level, so nothing else moves.

Change Only the Mode
The usual test runs a query at compatibility level 140 and again at level 150. That shows a difference, but it mixes effects. Other optimizer behavior depends on the level too, so you can’t tell how much belongs to batch mode. The hint DISALLOW_BATCH_MODE removes batch mode from one query and leaves the level alone. The two runs then differ in one thing only.
That is what a test of row mode vs batch mode needs. No columnstore index exists on this table, and the default plan still runs in batch mode.
The demo database is named BatchSpeedDemo, and its table holds three million sales lines. The table has a clustered primary key and no columnstore index. A formula fills it, so every run builds the same rows. Run the script on a test server. For the basics of batch mode, read Batch Mode on Rowstore: A Simple Example in SQL Server.
IF DB_ID(N'BatchSpeedDemo') IS NULL CREATE DATABASE BatchSpeedDemo;
GO
USE BatchSpeedDemo;
GO
DROP TABLE IF EXISTS dbo.SalesLines;
CREATE TABLE dbo.SalesLines (
    LineID    int          NOT NULL PRIMARY KEY,
    ProductID int          NOT NULL,
    Qty       smallint     NOT NULL,
    UnitPrice decimal(8,2) NOT NULL
);
INSERT INTO dbo.SalesLines (LineID, ProductID, Qty, UnitPrice)
SELECT n, 1 + (n % 40), 1 + (n % 5), 5 + (n % 20)
FROM (SELECT TOP (3000000) ROW_NUMBER() OVER (ORDER BY (SELECT NULL)) AS n
      FROM sys.all_objects AS a CROSS JOIN sys.all_objects AS b CROSS JOIN sys.all_objects AS c) AS x;
Check That Both Modes Return the Same Rows
A faster query is worthless if it returns a different answer. The next script stores the result of each mode in a temp table. It compares them with EXCEPT in both directions. MAXDOP 1 keeps each run on one thread, so the CPU time is easy to read.
SELECT ProductID, SUM(Qty * UnitPrice) AS Revenue, AVG(UnitPrice) AS AvgPrice, COUNT(*) AS Lines
INTO #RowResult
FROM dbo.SalesLines
GROUP BY ProductID
OPTION (MAXDOP 1, USE HINT('DISALLOW_BATCH_MODE'));

SELECT ProductID, SUM(Qty * UnitPrice) AS Revenue, AVG(UnitPrice) AS AvgPrice, COUNT(*) AS Lines
INTO #BatchResult
FROM dbo.SalesLines
GROUP BY ProductID
OPTION (MAXDOP 1);

SELECT (SELECT COUNT(*) FROM (SELECT * FROM #RowResult EXCEPT SELECT * FROM #BatchResult) AS a) AS OnlyInRowMode,
       (SELECT COUNT(*) FROM (SELECT * FROM #BatchResult EXCEPT SELECT * FROM #RowResult) AS b) AS OnlyInBatchMode;

DROP TABLE #RowResult, #BatchResult;| OnlyInRowMode | OnlyInBatchMode |
|---|---|
| 0 | 0 |
Both counts are 0, so the two modes return the same 40 rows. Now measure them.
Time Five Runs of Each Mode
One run proves little. The first run also pays for compiling the query and reading the pages, so a fair test discards it. The procedure below runs a query once as a warm-up, then runs it five times. It reports the average CPU time and the average elapsed time. The CPU time comes from the current request, in milliseconds. Watch the CPU time more than the elapsed time. A parallel plan can finish sooner and still burn more CPU, and the CPU is what you pay for.
CREATE OR ALTER VIEW dbo.RevenueByProduct AS
SELECT ProductID, SUM(Qty * UnitPrice) AS Revenue, AVG(UnitPrice) AS AvgPrice, COUNT(*) AS Lines
FROM dbo.SalesLines
GROUP BY ProductID;
GO
CREATE OR ALTER VIEW dbo.RevenueSmallRange AS
SELECT ProductID, SUM(Qty * UnitPrice) AS Revenue
FROM dbo.SalesLines
WHERE LineID BETWEEN 1 AND 5000
GROUP BY ProductID;
GO
CREATE OR ALTER PROCEDURE dbo.TimeQuery @Label nvarchar(40), @Sql nvarchar(max), @Runs int = 5
AS
BEGIN
    SET NOCOUNT ON;
    DECLARE @i int = 0, @start datetime2, @cpu0 int, @cpu1 int, @cpu bigint = 0, @ms bigint = 0, @n int;
    WHILE @i <= @Runs
    BEGIN
        SELECT @cpu0 = cpu_time FROM sys.dm_exec_requests WHERE session_id = @@SPID;
        SET @start = SYSDATETIME();
        EXEC sys.sp_executesql @Sql, N'@n int OUTPUT', @n = @n OUTPUT;
        SELECT @cpu1 = cpu_time FROM sys.dm_exec_requests WHERE session_id = @@SPID;
        IF @i > 0
        BEGIN
            SET @cpu += @cpu1 - @cpu0;
            SET @ms += DATEDIFF(MILLISECOND, @start, SYSDATETIME());
        END;
        SET @i += 1;
    END;
    SELECT @Label AS Query, @cpu / @Runs AS AvgCpuMs, @ms / @Runs AS AvgElapsedMs;
END;
Call it for each view in each mode. The hint sits inside the text that the procedure runs.
EXEC dbo.TimeQuery N'Aggregate, row mode',
     N'SELECT @n = COUNT(*) FROM dbo.RevenueByProduct OPTION (MAXDOP 1, USE HINT(''DISALLOW_BATCH_MODE''))';
EXEC dbo.TimeQuery N'Aggregate, batch mode',
     N'SELECT @n = COUNT(*) FROM dbo.RevenueByProduct OPTION (MAXDOP 1)';
EXEC dbo.TimeQuery N'Narrow range, row mode',
     N'SELECT @n = COUNT(*) FROM dbo.RevenueSmallRange OPTION (MAXDOP 1, USE HINT(''DISALLOW_BATCH_MODE''))';
EXEC dbo.TimeQuery N'Narrow range, batch mode',
     N'SELECT @n = COUNT(*) FROM dbo.RevenueSmallRange OPTION (MAXDOP 1)';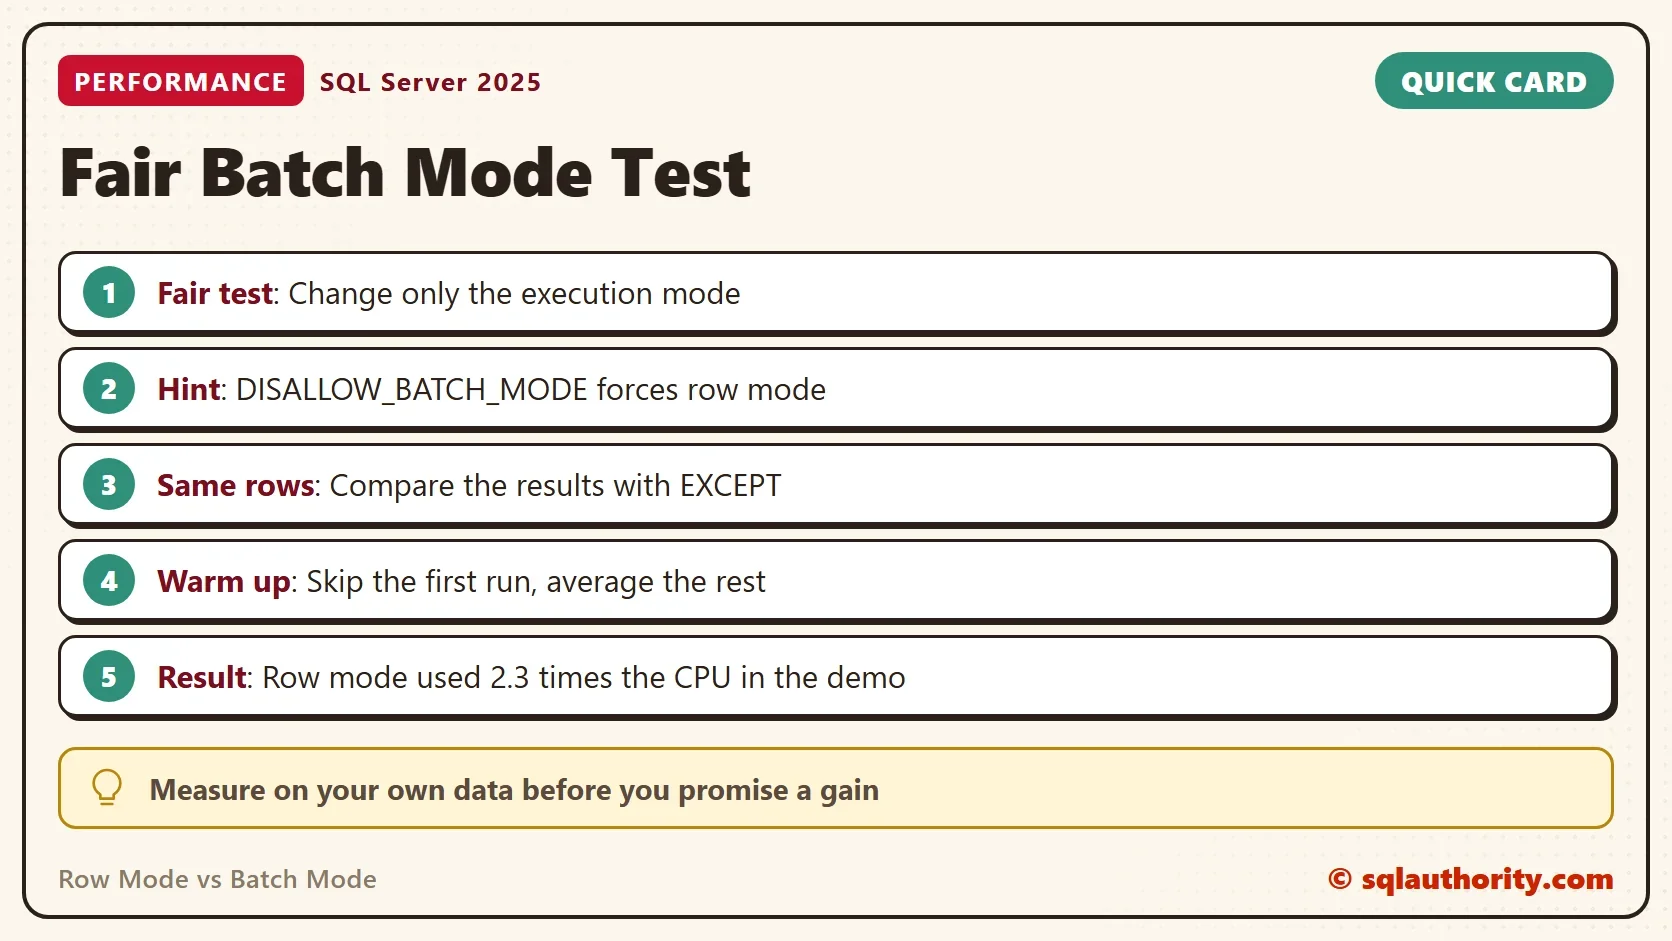
| Query | AvgCpuMs | AvgElapsedMs |
|---|---|---|
| Aggregate, row mode | 486 | 486 |
| Aggregate, batch mode | 209 | 209 |
| Narrow range, row mode | 1 | 1 |
| Narrow range, batch mode | 1 | 1 |
Each call returns one row, and the table above combines the four. On the full aggregate, row mode used about 2.3 times the CPU time of batch mode. The elapsed time dropped by the same factor. Your numbers will differ, because they depend on your hardware, but the order of the rows holds. A repeat of the whole script on the shared server gave larger times and the same gap.
Confirm the Mode in the Plan
Trust the hint, and still check the plan once. In a graphical plan in SSMS, select an operator and read its Actual Execution Mode in the Properties window. The aggregate and the scan should say Batch in the default run and Row in the hinted run. The companion post shows how to read the same value with T-SQL.
Where Batch Mode Gains Nothing
The narrow range query reads 5,000 rows and takes about a millisecond in either mode. The batch operators have nothing to save when only a few rows flow through them. The gain grows with the number of rows that reach the aggregate. A point lookup, a short range or a query that waits on disk won’t change.
Don’t judge by the percentages in the plan. The optimizer’s cost percentages are estimates. They can show two plans as close to equal when one runs twice as fast. Measure the CPU time and the elapsed time, as above.
Is the Hint a Fair Test?
You could argue that the hint makes the test artificial, because production has no hint. The hint only switches a feature off, and production runs with the feature on. So the comparison shows what the feature gives you for that query. The default plan in production is the batch mode plan, as long as the table and query qualify.
What to Remember
Compare row mode vs batch mode with a hint at one compatibility level, not by changing the level. Check that both modes return the same rows, discard a warm-up run and average several runs. In the demo, batch mode cut the CPU time of a large aggregate by more than half. It changed nothing on a narrow range.
Test your own heavy reports the same way before you promise anyone a gain. When you finish with the demo, run the cleanup script.
USE master;
GO
ALTER DATABASE BatchSpeedDemo SET SINGLE_USER WITH ROLLBACK IMMEDIATE;
DROP DATABASE BatchSpeedDemo;
A speed claim is not an opinion, it is a measurement that someone else can repeat.
Published by Pinal Dave on SQLAuthority. More of my work at pinaldave.com.
Discover more from SQL Authority with Pinal Dave
Subscribe to get the latest posts sent to your email.



1 Comment. Leave new
I see that the only difference in the 2 queries was the compatibility level. However, it is my understanding that the plan optimizer will only consider BatchMode if a Columnstore Index exists on the table. Did such an index exist and if so can you provide the details on the index? TIA