
What a data scientist does is turn a vague question into an answer that people can trust and act on. The work is less about clever algorithms than most people expect. It’s about framing, cleaning, checking and explaining, and each of those skills still matters today.

It Starts With a Question
Nobody asks for a model. People ask why sales dropped, or which customers will leave. The first skill is turning that worry into a question that data can answer. “Analyze our rides” is a topic. “Which bike stations run out of bikes before noon?” is a question.
A good question names a decision that someone will make. If no decision depends on the answer, the work is a hobby. Before looking at any data, ask who will act on the result and what they would do differently.
Getting and Cleaning the Data
Next you find the data and bring it together. It sits in a database, a spreadsheet, a log file or an API, and each source has its own habits. SQL is the usual way in, and Python is the usual next tool.
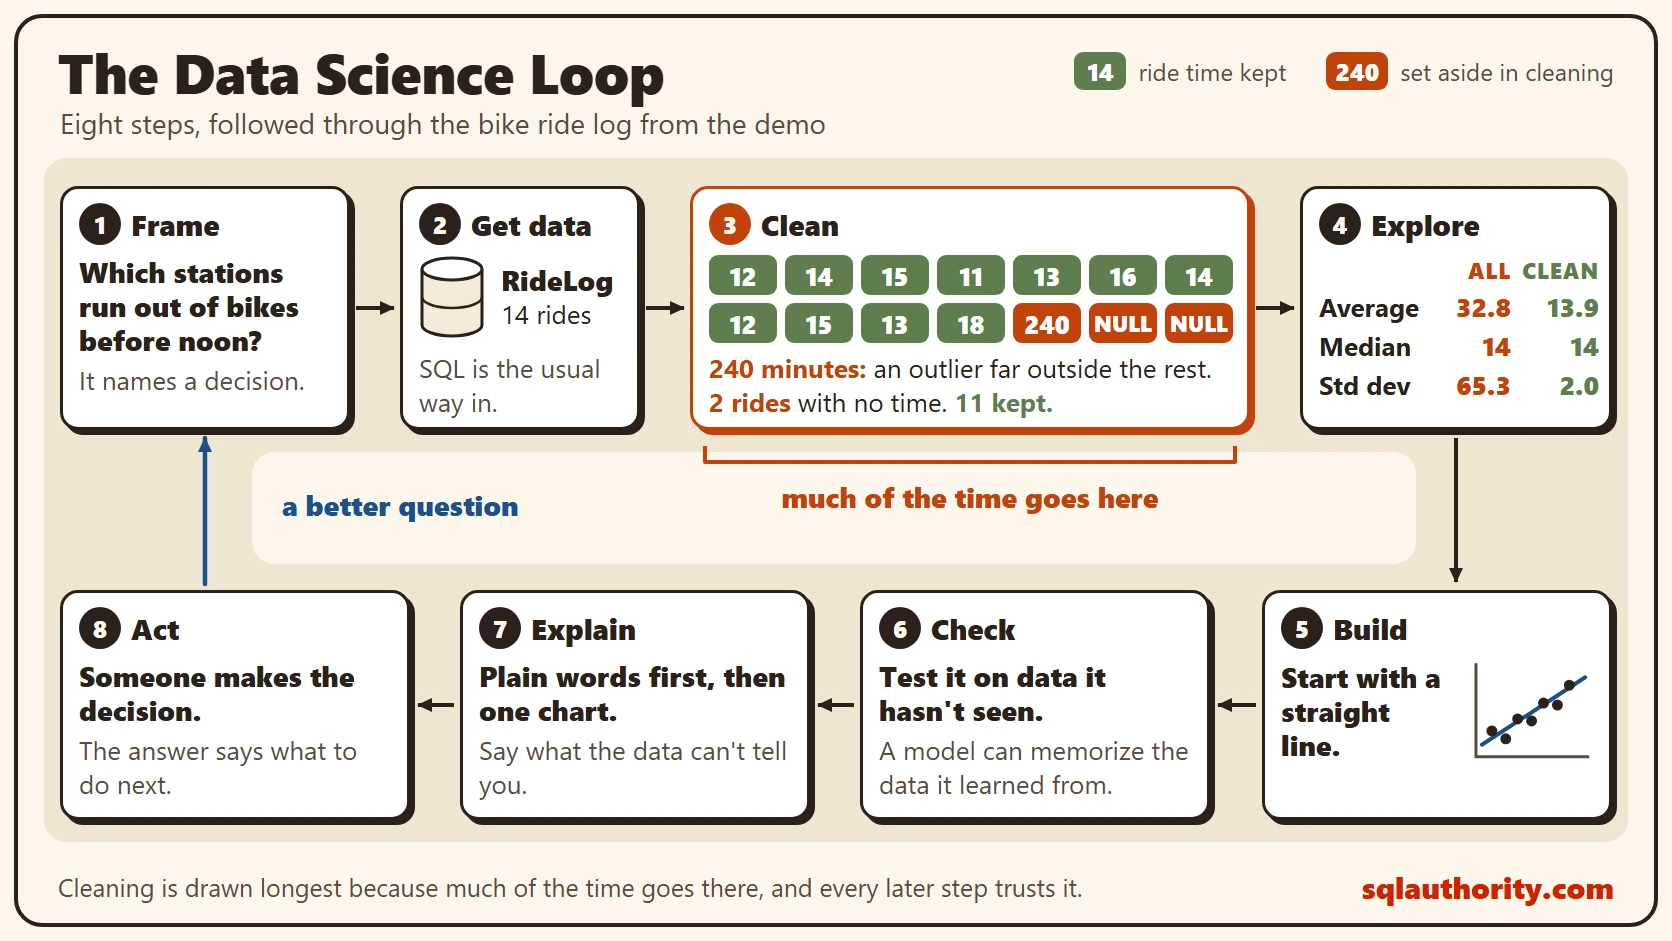
Then comes cleaning, and this is where much of the time goes. You look for empty values, duplicates, impossible numbers and mixed units. Every other ride in this log lasts 11 to 18 minutes. A 240-minute ride is an outlier, a value far outside the rest. It can be a real long rental or a recording error. A model can’t tell which, so someone has to look. The Data Governance: Catalog, Lineage and Data Quality post covers checks like these.
The picture below shows the whole job as a loop. You frame the question, get the data and clean it. Then you explore it, build a model and check the model. After that you explain the result and act on it, and the action raises a better question. The cleaning step is drawn the longest on purpose.
Statistics Before Models
Before any model, you describe the data with a few numbers. Count the rows. Find the average, the median and the spread. These summaries catch mistakes early, and sometimes they answer the question without a model at all.
When a model is needed, start with the simplest one that could work, such as a straight line. Then check it on data it hasn’t seen. A model can score well on the data it learned from because it memorized that data. Checking is a skill, not a formality. Two numbers that move together don’t prove that one causes the other, and checking that is part of the job.
Explaining the Result
The last step is the one people skip. A result nobody understands changes nothing. Say the answer in plain words first. Show one chart that carries the point, and state what the data can’t tell you.
Good explanations also say what to do next. That closes the loop, and it starts the next question. The job is to loop through these steps, and to make each pass better than the last.
The Skills Behind the Steps
What a data scientist does rests on skills that tools haven’t replaced. Framing needs curiosity and knowledge of the business. Cleaning needs patience and a feel for what a normal value looks like. Exploring needs statistics, and building needs some code, usually SQL and Python.
Explaining needs plain writing and an honest account of the limits. Of all of these, I’d rank the last one highest. A modest result that people understand beats a clever one that nobody believes.
Summary Statistics in T-SQL
You can see the cleaning and statistics steps in a few lines of SQL. The script creates a database called SqlBigDataStats, used only for this example, so run it on a test server. The table is a small bike rental log. Two rides have no recorded time, and one ride is an outlier at 240 minutes.
IF DB_ID(N'SqlBigDataStats') IS NULL CREATE DATABASE SqlBigDataStats;
GO
USE SqlBigDataStats;
GO
DROP TABLE IF EXISTS dbo.RideLog;
CREATE TABLE dbo.RideLog
(
    RideID int NOT NULL PRIMARY KEY,
    Station nvarchar(30) NOT NULL,
    Minutes int NULL
);
INSERT INTO dbo.RideLog (RideID, Station, Minutes)
VALUES (1, N'Riverside', 12), (2, N'Riverside', 14), (3, N'Riverside', 15), (4, N'Market Street', 11),
       (5, N'Market Street', 13), (6, N'Market Street', 16), (7, N'Riverside', 14), (8, N'Library', 12),
       (9, N'Library', 15), (10, N'Library', 13), (11, N'Library', 18), (12, N'Riverside', 240),
       (13, N'Market Street', NULL), (14, N'Library', NULL);
Always look first. This query counts the rows and finds the smallest and largest values.
SELECT COUNT(*) AS RideRows, COUNT(Minutes) AS RidesWithTime, MIN(Minutes) AS MinMinutes, MAX(Minutes) AS MaxMinutes
FROM dbo.RideLog;
| RideRows | RidesWithTime | MinMinutes | MaxMinutes |
|---|---|---|---|
| 14 | 12 | 11 | 240 |
There are 14 rows but only 12 times, and the maximum is 240. Both facts need a decision. The next query computes the usual summary twice. It covers all rides, then only the rides of 60 minutes or less. Averages ignore empty values, and the filter removes them from the second set too. The median uses PERCENTILE_CONT, which needs a window in T-SQL. That’s why the query uses SELECT DISTINCT to keep one row per set.
WITH Sets AS
(
    SELECT N'All rides' AS DataSet, Minutes FROM dbo.RideLog
    UNION ALL
    SELECT N'Cleaned', Minutes FROM dbo.RideLog WHERE Minutes <= 60
)
SELECT DISTINCT DataSet,
       COUNT(Minutes) OVER (PARTITION BY DataSet) AS RidesWithTime,
       CAST(AVG(Minutes * 1.0) OVER (PARTITION BY DataSet) AS decimal(6,1)) AS AvgMinutes,
       PERCENTILE_CONT(0.5) WITHIN GROUP (ORDER BY Minutes) OVER (PARTITION BY DataSet) AS MedianMinutes,
       CAST(STDEV(Minutes) OVER (PARTITION BY DataSet) AS decimal(6,1)) AS StdDevMinutes
FROM Sets
ORDER BY DataSet;
One outlier, the 240-minute ride, moved the average from 13.9 to 32.8 and the standard deviation from 2.0 to 65.3. The median stayed at 14. STDEV reports the sample standard deviation, which suits a log that stands for a larger set of rides. That’s why the median and the spread belong beside the average. A big gap between them means something is odd.
On a large table, an exact median is slow, so SQL Server also has an approximate one. This query gives the median per station on the cleaned rows.
SELECT Station, COUNT(Minutes) AS Rides, CAST(AVG(Minutes * 1.0) AS decimal(6,1)) AS AvgMinutes,
       APPROX_PERCENTILE_CONT(0.5) WITHIN GROUP (ORDER BY Minutes) AS ApproxMedian
FROM dbo.RideLog
WHERE Minutes <= 60
GROUP BY Station
ORDER BY Station;| Station | Rides | AvgMinutes | ApproxMedian |
|---|---|---|---|
| Library | 4 | 14.5 | 14 |
| Market Street | 3 | 13.3 | 13 |
| Riverside | 4 | 13.8 | 14 |
The usual objection is that automated tools now clean data and build models, so these skills matter less. The tools do speed up both steps. They can’t know whether a 240-minute ride is real or an error. They can’t know whether dropping the row is the right call. A person has to judge whether the answer makes sense.
What to Remember
What a data scientist does comes down to a few habits. Frame the question around a decision. Spend time on cleaning, because every later step trusts it. Describe the data with a few honest numbers before you build anything, and check models on data they haven’t seen.
A good first query on any new table counts the rows and finds the minimum and maximum. It takes a minute, and it catches bad averages early. When you finish testing, remove the example database.
USE master;
GO
ALTER DATABASE SqlBigDataStats SET SINGLE_USER WITH ROLLBACK IMMEDIATE;
DROP DATABASE SqlBigDataStats;
A data scientist is not a person who builds models, it is a person who earns trust in an answer.
Published by Pinal Dave on SQLAuthority. More of my work at pinaldave.com.
Discover more from SQL Authority with Pinal Dave
Subscribe to get the latest posts sent to your email.



5 Comments. Leave new
thnx a lot for the very good post. Could u pls suggest any book or any exam for this.
Is there any suggested e-book readily available for this?
Hi Pinal,
I am following whole series.About your sentence “They should have a solid foundation of various data algorithms, modeling and statistics methodology”
Can you guide me to master them. Algorithms, modeling and statistics methodology.I know experience is the key but your precious guidance might help me.
great post.it,s really helpful.
There are some fantastic user-sourced answers to this question on Quora: http://www.quora.com/Data-Science/How-do-I-become-a-data-scientist