
Big Data Analytics turns large piles of data into answers, and the answers come in four kinds. They’re descriptive, diagnostic, predictive and prescriptive. Each kind answers a different question, and each one builds on the one before it.

Start With the Question
When a lot of data sits in front of you, the first question is what all of it means. The answer depends on what you ask. A total, a reason, a forecast and a recommendation are four different jobs, and they need different tools.
Most Big Data projects exist to pull answers out of data that’s too large for a spreadsheet. Familiar terms map onto the four kinds. Slicing and dicing is descriptive. Real-time monitoring is descriptive too, only faster. Anomaly detection borrows predictive models to flag what doesn’t fit. Text analysis turns messy text into columns, so the other kinds can use it.
The Four Kinds of Analytics
Picture a ladder. Each rung is harder than the last, and each rung is worth more to the business. You can’t skip one, because every rung stands on the one below.
Descriptive analytics says what happened. It’s the total, the average, the count by month. Diagnostic analytics asks why. It breaks a total into parts, such as product, store or region, and finds which part moved. Predictive analytics asks what will happen next. It uses past patterns to estimate the future. Prescriptive analytics asks what we should do. It turns the estimate into a recommended action.
A retail dashboard shows the idea. The weekly sales total is descriptive. Drilling from the total down to one store is diagnostic. A demand forecast is predictive, and a suggested reorder list is prescriptive.
The rungs also differ in who uses them. Managers read descriptive results every day. Analysts do the diagnostic work when a number surprises someone. Predictive and prescriptive work needs history, testing and an owner who acts on the answer. A recommendation nobody follows is only a number.
Let’s use one small business. A juice shop sells two products, Mango Juice and Green Smoothie, and we have six months of units sold. The same questions work on 12 rows or 12 billion. Only the engine changes, from SQL Server to something like Apache Spark.
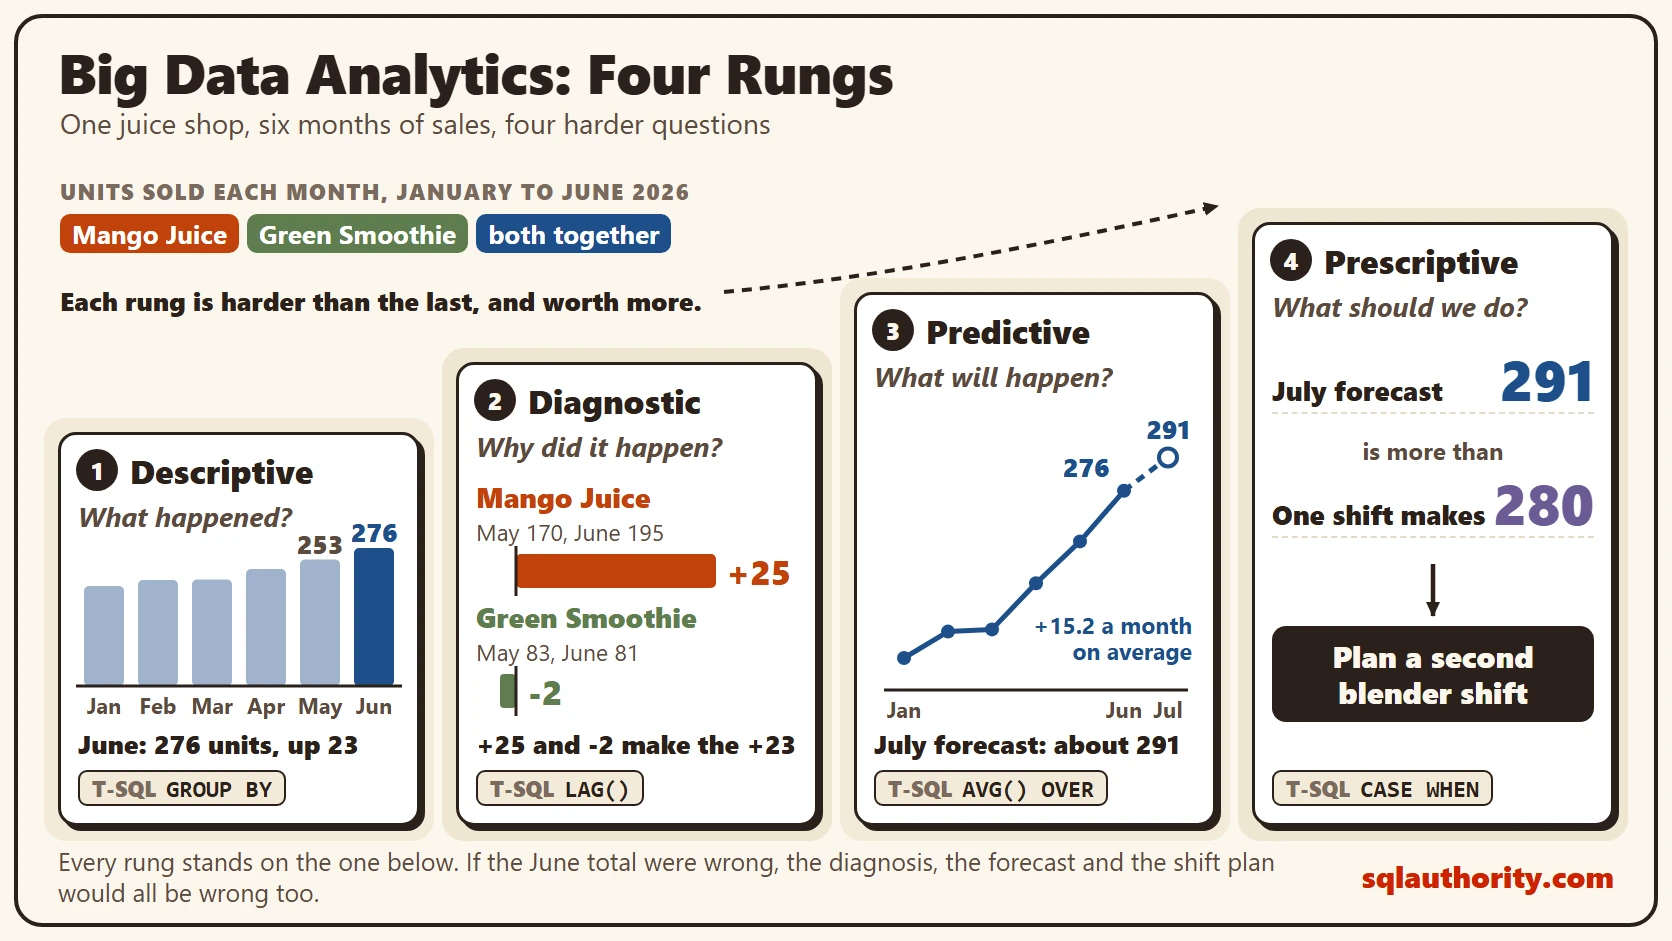
The diagram shows the juice shop climbing the ladder. At the bottom, the shop sold 276 units in June, up from 253 the month before. One rung up, Mango Juice grew by 25 units while Green Smoothie shrank by 2, so mango explains the growth. Next, the trend points to about 291 units in July. At the top, one shift makes only 280 units a month. The advice is to plan a second blender shift.
What Changes at Big Data Scale
On a laptop, one query reads every row. At large scale, the data is cut into partitions on many machines, and each machine works on its own piece. That’s the same idea behind MapReduce Explained: Map, Shuffle and Reduce Step by Step. Big data analytics changes the plan, not the question.
Two things get harder as the data grows. The upper rungs need years of history, which is expensive to store and clean. Real-time monitoring needs data to arrive as it happens, not once a night. Window functions still work, since engines such as Spark SQL support the same syntax.
The Same Ladder in T-SQL
Every rung can be written with window functions. A window function looks at neighboring rows without collapsing them. The script creates a database called SqlBigDataAnalytics, used only for this example, so run it on a test server.
IF DB_ID(N'SqlBigDataAnalytics') IS NULL CREATE DATABASE SqlBigDataAnalytics;
GO
USE SqlBigDataAnalytics;
GO
DROP TABLE IF EXISTS dbo.MonthlySales;
CREATE TABLE dbo.MonthlySales
(
    SaleMonth date NOT NULL,
    Product nvarchar(30) NOT NULL,
    Units int NOT NULL,
    CONSTRAINT PK_MonthlySales PRIMARY KEY (SaleMonth, Product)
);
INSERT INTO dbo.MonthlySales (SaleMonth, Product, Units)
VALUES ('2026-01-01', N'Mango Juice', 120), ('2026-01-01', N'Green Smoothie', 80),
       ('2026-02-01', N'Mango Juice', 130), ('2026-02-01', N'Green Smoothie', 82),
       ('2026-03-01', N'Mango Juice', 128), ('2026-03-01', N'Green Smoothie', 85),
       ('2026-04-01', N'Mango Juice', 150), ('2026-04-01', N'Green Smoothie', 84),
       ('2026-05-01', N'Mango Juice', 170), ('2026-05-01', N'Green Smoothie', 83),
       ('2026-06-01', N'Mango Juice', 195), ('2026-06-01', N'Green Smoothie', 81);
Rung one is a plain GROUP BY. It says what happened each month.
SELECT SaleMonth, SUM(Units) AS TotalUnits
FROM dbo.MonthlySales
GROUP BY SaleMonth
ORDER BY SaleMonth;
| SaleMonth | TotalUnits |
|---|---|
| 2026-01-01 | 200 |
| 2026-02-01 | 212 |
| 2026-03-01 | 213 |
| 2026-04-01 | 234 |
| 2026-05-01 | 253 |
| 2026-06-01 | 276 |
Rung two asks why June grew. LAG fetches the previous month for the same product, so the subtraction shows who moved. The filter sits outside the CTE, because filtering inside it would remove the rows LAG needs.
WITH Changes AS
(
    SELECT SaleMonth, Product, Units,
           Units - LAG(Units) OVER (PARTITION BY Product ORDER BY SaleMonth) AS ChangeFromLastMonth
    FROM dbo.MonthlySales
)
SELECT SaleMonth, Product, Units, ChangeFromLastMonth
FROM Changes
WHERE SaleMonth = '2026-06-01'
ORDER BY Product;| SaleMonth | Product | Units | ChangeFromLastMonth |
|---|---|---|---|
| 2026-06-01 | Green Smoothie | 81 | -2 |
| 2026-06-01 | Mango Juice | 195 | 25 |
Rung three looks ahead. A moving average smooths the noise, and the monthly change shows the trend. The window covers the current month and the two before it.
WITH Monthly AS
(
    SELECT SaleMonth, SUM(Units) AS TotalUnits
    FROM dbo.MonthlySales
    GROUP BY SaleMonth
)
SELECT SaleMonth, TotalUnits,
       CAST(AVG(TotalUnits * 1.0) OVER (ORDER BY SaleMonth ROWS BETWEEN 2 PRECEDING AND CURRENT ROW) AS decimal(7,1)) AS MovingAvg3,
       TotalUnits - LAG(TotalUnits) OVER (ORDER BY SaleMonth) AS MonthlyChange
FROM Monthly
ORDER BY SaleMonth;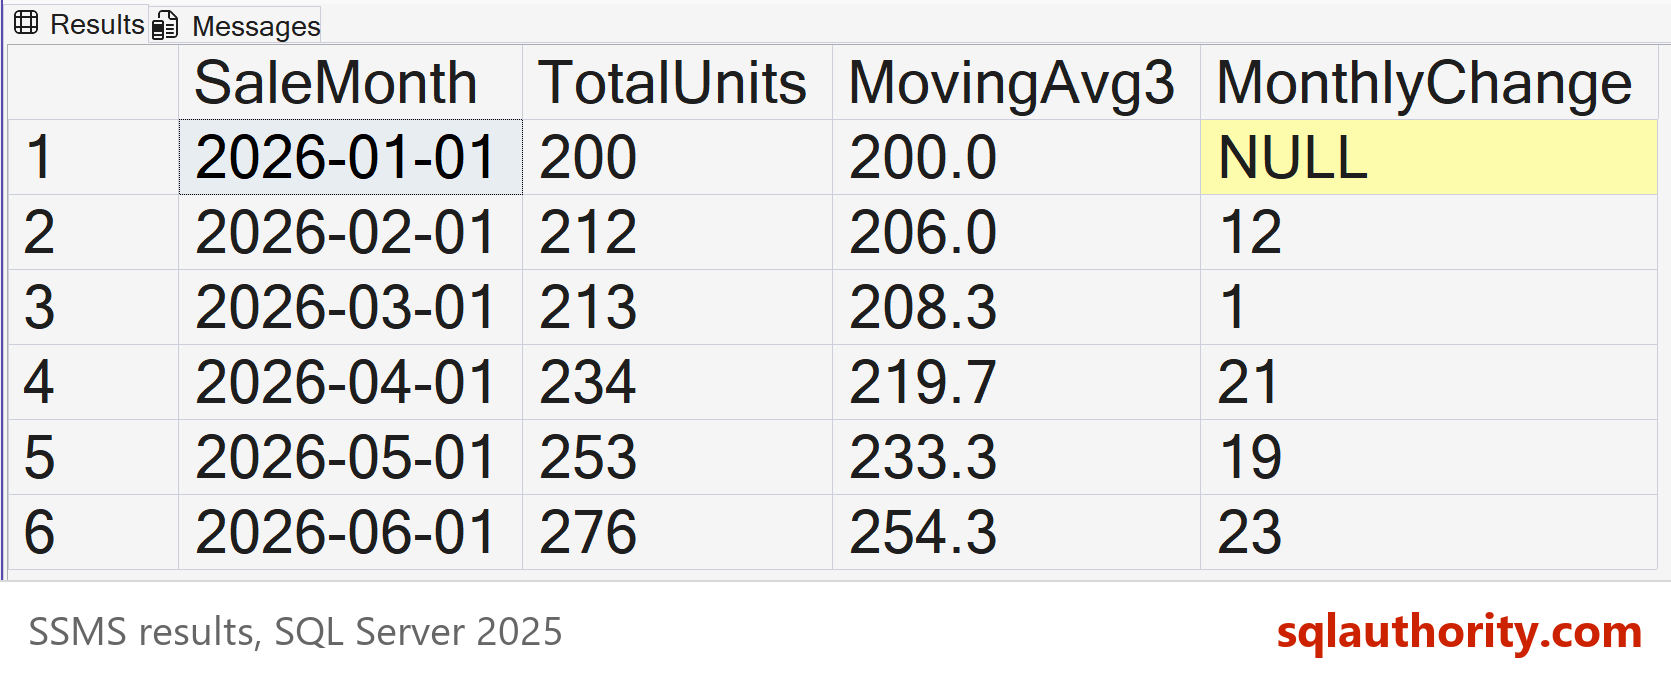
The first month has no neighbors, so its average covers one row and its change is NULL. By June the average is 254.3. The five monthly changes add up to 76, an average of 15.2 units. That’s enough for a straight-line forecast.
Rung four turns the forecast into advice. Window functions can’t nest, so the monthly change sits in its own step. The shop’s one-shift capacity of 280 units is a rule we made up for this example.
WITH Monthly AS
(
    SELECT SaleMonth, SUM(Units) AS TotalUnits
    FROM dbo.MonthlySales
    GROUP BY SaleMonth
),
Steps AS
(
    SELECT SaleMonth, TotalUnits, TotalUnits - LAG(TotalUnits) OVER (ORDER BY SaleMonth) AS MonthlyChange
    FROM Monthly
)
SELECT TOP (1) TotalUnits AS JuneUnits,
       CAST(AVG(MonthlyChange * 1.0) OVER () AS decimal(7,1)) AS AvgMonthlyChange,
       CAST(TotalUnits + AVG(MonthlyChange * 1.0) OVER () AS decimal(7,1)) AS JulyForecast,
       CASE WHEN TotalUnits + AVG(MonthlyChange * 1.0) OVER () > 280 THEN N'Plan a second blender shift' ELSE N'Keep the current schedule' END AS Action
FROM Steps
ORDER BY SaleMonth DESC;| JuneUnits | AvgMonthlyChange | JulyForecast | Action |
|---|---|---|---|
| 276 | 15.2 | 291.2 | Plan a second blender shift |
A forecast of 291.2 beats the capacity of 280, so the query recommends more capacity. A straight line is a simple baseline model, good for teaching and not for decisions. Before relying on it, a real shop would test it on held-out months and measure its uncertainty. It would also check seasons and holidays.
Real prescriptive work compares options, such as an extra shift against a second blender, using optimization or simulation. The CASE rule here is the smallest possible version of that step.
The case against the ladder is that only the top rung matters, because decisions are what pay. The reverse is true. Advice built on a wrong description is worse than no advice. If the June totals were wrong, the diagnosis, the forecast and the shift plan would all be wrong too.
What to Remember
Name the kind of question before you pick a tool. Totals answer what happened, breakdowns answer why, trends answer what’s next, and rules answer what to do. Check the lower rungs before you trust the upper ones.
Every dashboard stands on one rung. Most stop at the first, and that’s fine when the question is only what happened. When you finish testing, remove the example database.
USE master;
GO
ALTER DATABASE SqlBigDataAnalytics SET SINGLE_USER WITH ROLLBACK IMMEDIATE;
DROP DATABASE SqlBigDataAnalytics;
Big data analytics is not a bigger report, it is a ladder of better questions.
Published by Pinal Dave on SQLAuthority. More of my work at pinaldave.com.
Discover more from SQL Authority with Pinal Dave
Subscribe to get the latest posts sent to your email.




2 Comments. Leave new
Please share references from where to learn more about analytics
Good informative content