
Columnar, Graph and Spatial Databases are three data models. Each one is shaped like the question you plan to ask. One answers totals over millions of rows. One follows relationships from person to person. One measures the distance between places.

Columnar: Read Only the Columns You Need
A row store keeps every column of a row together. A columnar database keeps every value of one column together. Picture a table of bike rides with five columns. An average fare needs two of them. A columnar engine reads those two and never touches the other three.
The values in one column look alike, so they compress well. That makes columnar storage a good fit for sums and averages over many rows. It’s a poor fit for fetching one whole row, or for a steady stream of single row updates. OLTP vs OLAP: Why Transactions and Analytics Need Different Designs explains that trade in more detail. SQL Server calls its version columnstore.
Graph: Data Made of Relationships
A graph database stores nodes and edges. A node is a thing, such as a person. An edge is a relationship between two nodes, such as “knows”. The strength of the model is navigation. You start at one node and follow the edges.
In a plain table, friends of friends means joining the table to itself once for every hop. A graph query describes the path instead. Graphs suit social networks, recommendations and routes. They add little when your questions are totals, because nothing in the data is a relationship.
Spatial: Data With a Location
Spatial data describes where something is. A store is a point. A road is a line. A delivery area is a polygon. The database knows the geometry. It can tell how far apart two points are. It can tell whether a point sits inside an area, and which stores are nearest.
The geography type does this on a round Earth. That matters because a flat grid gives the wrong distance across a long trip. Every app that shows a “near me” list depends on this kind of query.
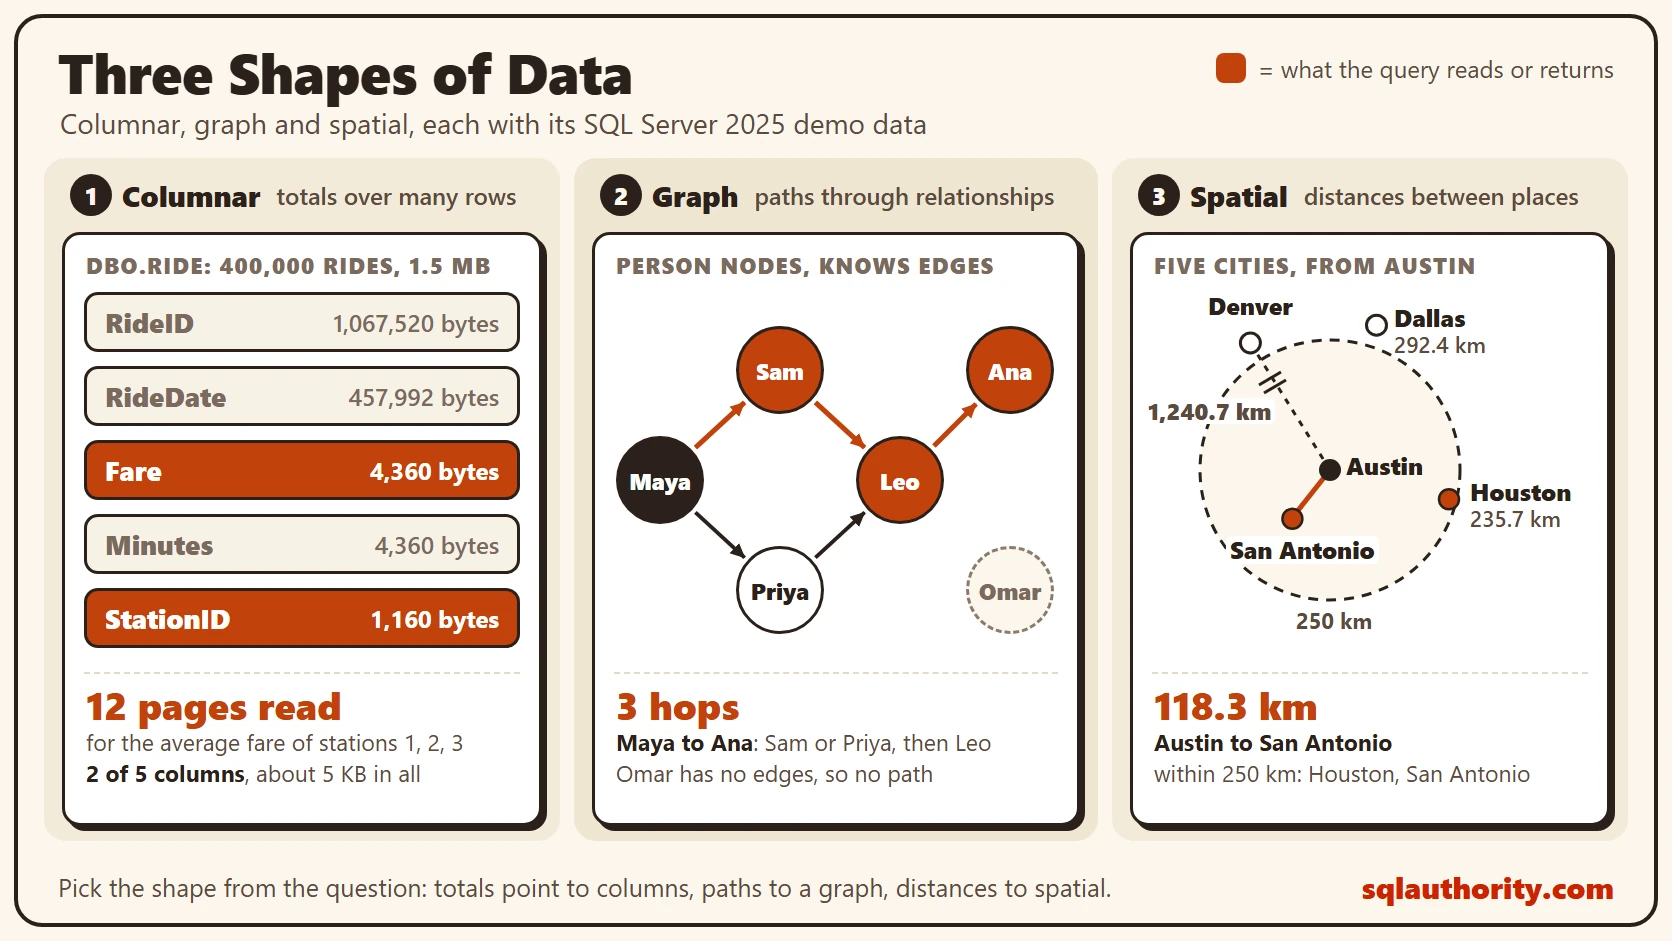
The diagram has one panel for each shape. In the first, the five columns of a ride table are stored apart. An average fare reads only the fare and station columns. In the second, six people are nodes joined by edges. One path runs from Maya through Sam and Leo to Ana. Priya offers a second route, and Omar has no edges at all. In the third, five cities are points on a map, and Austin to San Antonio is 118.3 km.
Try It: Columnstore
You can try all three in SQL Server 2025. This script creates a database called SqlBigDataThreeShapes, used only for this example, so run it on a test server. It builds a table of 400,000 bike rides, stored as a clustered columnstore index from the start.
IF DB_ID(N'SqlBigDataThreeShapes') IS NULL CREATE DATABASE SqlBigDataThreeShapes;
GO
USE SqlBigDataThreeShapes;
GO
DROP TABLE IF EXISTS dbo.Ride;
CREATE TABLE dbo.Ride
(
    RideID int NOT NULL,
    StationID int NOT NULL,
    RideDate date NOT NULL,
    Minutes int NOT NULL,
    Fare decimal(6,2) NOT NULL,
    INDEX CCI_Ride CLUSTERED COLUMNSTORE
);
INSERT INTO dbo.Ride (RideID, StationID, RideDate, Minutes, Fare)
SELECT value, value % 40 + 1, DATEADD(DAY, value % 365, '20260101'), value % 55 + 5, (value % 55 + 5) * 0.15 + 1
FROM GENERATE_SERIES(1, 400000);
Each column is stored in its own segments. This query adds up the segment bytes each column uses on disk. Dictionaries are stored apart and aren’t included.
SELECT c.name AS ColumnName, SUM(s.on_disk_size) AS Bytes
FROM sys.column_store_segments AS s
JOIN sys.partitions AS p ON p.hobt_id = s.hobt_id
JOIN sys.columns AS c ON c.object_id = p.object_id AND c.column_id = s.column_id
WHERE p.object_id = OBJECT_ID(N'dbo.Ride')
GROUP BY c.name
ORDER BY Bytes DESC;
| ColumnName | Bytes |
|---|---|
| RideID | 1,067,520 |
| RideDate | 457,992 |
| Fare | 4,360 |
| Minutes | 4,360 |
| StationID | 1,160 |
The sizes differ a lot. RideID holds 400,000 different numbers, so it’s the largest. The other values repeat in a pattern, so they shrink to a few kilobytes. Now run a report that needs only two columns.
SET STATISTICS IO ON;

SELECT StationID, AVG(Fare) AS AvgFare FROM dbo.Ride WHERE StationID IN (1, 2, 3) GROUP BY StationID ORDER BY StationID;

SET STATISTICS IO OFF;
It returned 5.500225, 5.649625 and 5.799625 for the three stations. It read 12 large object pages. RideID and RideDate, which hold most of the table, stayed unread.
Try It: Graph Tables
SQL Server stores a graph in two kinds of table. A node table holds the things, and an edge table holds the relationships. This script creates six people and five “knows” edges. Each edge points from one person to another.
DROP TABLE IF EXISTS dbo.Knows;
DROP TABLE IF EXISTS dbo.Person;
CREATE TABLE dbo.Person (PersonID int NOT NULL PRIMARY KEY, Name nvarchar(40) NOT NULL) AS NODE;
CREATE TABLE dbo.Knows AS EDGE;
INSERT INTO dbo.Person (PersonID, Name) VALUES (1, N'Maya'), (2, N'Sam'), (3, N'Priya'), (4, N'Leo'), (5, N'Ana'), (6, N'Omar');
INSERT INTO dbo.Knows ($from_id, $to_id)
SELECT a.$node_id, b.$node_id
FROM (VALUES (1, 2), (1, 3), (2, 4), (3, 4), (4, 5)) AS e (FromID, ToID)
JOIN dbo.Person AS a ON a.PersonID = e.FromID
JOIN dbo.Person AS b ON b.PersonID = e.ToID;
The MATCH clause describes the path as an arrow pattern. This query asks for the friends of Maya’s friends.
SELECT p1.Name AS Person, p2.Name AS Through, p3.Name AS FriendOfFriend
FROM dbo.Person AS p1, dbo.Knows AS k1, dbo.Person AS p2, dbo.Knows AS k2, dbo.Person AS p3
WHERE MATCH(p1-(k1)->p2-(k2)->p3) AND p1.Name = N'Maya'
ORDER BY p2.Name;
| Person | Through | FriendOfFriend |
|---|---|---|
| Maya | Priya | Leo |
| Maya | Sam | Leo |
Leo shows up twice, because two paths lead to them. SHORTEST_PATH goes further. It follows edges for as many hops as it takes, and you don’t say how many.
SELECT p1.Name AS StartPerson,
       STRING_AGG(p2.Name, N' -> ') WITHIN GROUP (GRAPH PATH) AS Path,
       COUNT(p2.Name) WITHIN GROUP (GRAPH PATH) AS Hops
FROM dbo.Person AS p1, dbo.Knows FOR PATH AS k, dbo.Person FOR PATH AS p2
WHERE MATCH(SHORTEST_PATH(p1(-(k)->p2)+)) AND p1.Name = N'Maya'
ORDER BY Hops, Path;| StartPerson | Path | Hops |
|---|---|---|
| Maya | Priya | 1 |
| Maya | Sam | 1 |
| Maya | Sam -> Leo | 2 |
| Maya | Sam -> Leo -> Ana | 3 |
Leo is two hops from Maya by two routes, through Sam or through Priya. Ana is three hops away, also by two routes: Sam, Leo, Ana or Priya, Leo, Ana. SHORTEST_PATH returns one route for each person and doesn’t say which one when routes tie. My run showed Sam, and yours can show Priya instead. Omar has no edges, so Maya can’t reach them.
Try It: Geography
The geography type stores a point as latitude and longitude. The number 4326 names the standard coordinate system for GPS. This table holds five cities.
DROP TABLE IF EXISTS dbo.Store;
CREATE TABLE dbo.Store (StoreID int NOT NULL PRIMARY KEY, City nvarchar(40) NOT NULL, Location geography NOT NULL);
INSERT INTO dbo.Store (StoreID, City, Location)
VALUES (1, N'Austin', geography::Point(30.2672, -97.7431, 4326)),
       (2, N'San Antonio', geography::Point(29.4241, -98.4936, 4326)),
       (3, N'Dallas', geography::Point(32.7767, -96.7970, 4326)),
       (4, N'Houston', geography::Point(29.7604, -95.3698, 4326)),
       (5, N'Denver', geography::Point(39.7392, -104.9903, 4326));
STDistance returns meters. The first query lists every city by its distance from Austin. The second keeps only the cities within 250 kilometers.
DECLARE @here geography = (SELECT Location FROM dbo.Store WHERE City = N'Austin');

SELECT City, CAST(Location.STDistance(@here) / 1000.0 AS decimal(8,1)) AS Km
FROM dbo.Store
ORDER BY Km;

SELECT City FROM dbo.Store WHERE Location.STDistance(@here) <= 250000 AND City <> N'Austin' ORDER BY City;
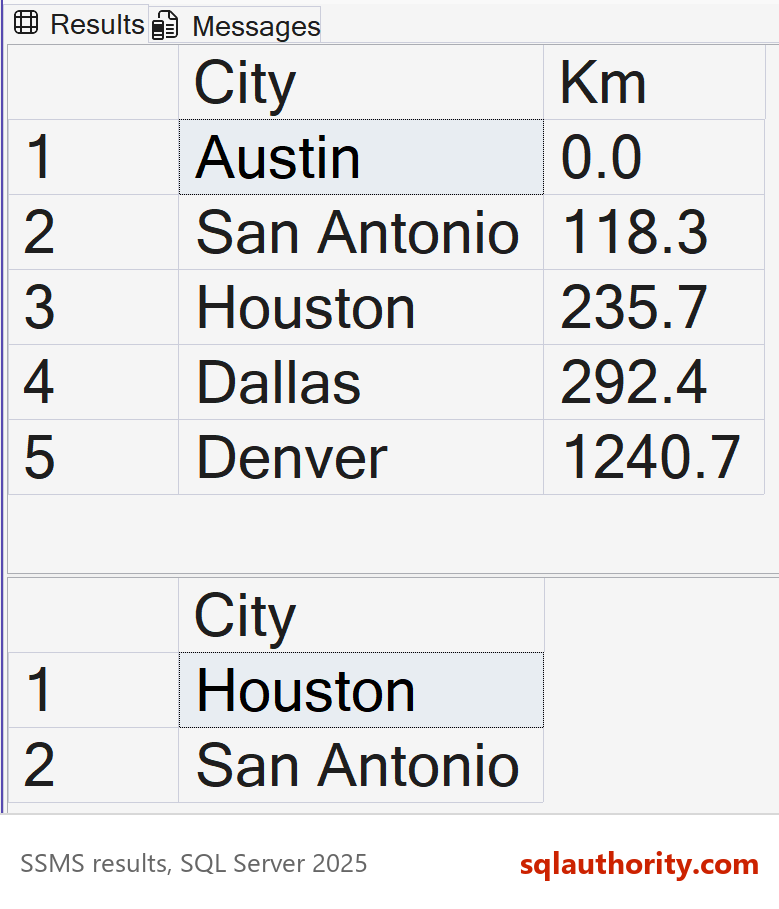
San Antonio is 118.3 km away, and Denver is 1,240.7 km away. The second query returned Houston and San Antonio. On a large table, a spatial index keeps a near me query from measuring every row.
The Case Against All Three
The plain alternative deserves a hearing. A relational table can hold ride totals, a friends list and coordinates as plain columns. Joins can answer friends of friends. For small data, that’s the right call. The special shapes pay off when the question is hard to write any other way. A path of unknown length is one example. A distance on a round Earth is another. For many workloads, SQL Server 2025 covers all three without a separate product.
What to Remember
Pick the shape from the question. Totals over many rows and a few columns point to columnar. Paths through relationships point to graph. Distances and areas point to spatial. Columnar, graph and spatial databases don’t replace the relational table, they sit beside it.
A good first step is to write down the three most common questions. Their shape points to the model the data wants.
When you finish testing, remove the example database.
USE master;
GO
ALTER DATABASE SqlBigDataThreeShapes SET SINGLE_USER WITH ROLLBACK IMMEDIATE;
DROP DATABASE SqlBigDataThreeShapes;
Columnar, graph and spatial databases are not exotic extras, they are tools shaped like the question.
Published by Pinal Dave on SQLAuthority. More of my work at pinaldave.com.
Discover more from SQL Authority with Pinal Dave
Subscribe to get the latest posts sent to your email.




2 Comments. Leave new
Nice Pinal