
OLTP vs OLAP is the difference between recording what’s happening now and studying what’s already happened. A design tuned for one of those jobs tends to be slower at the other. Indexes can narrow the gap. Once you see why, a lot of design choices stop looking like opinions.

Two Jobs, Two Designs
OLTP stands for online transaction processing. It’s the database behind a shop counter, a booking page or a payment screen. OLAP stands for online analytical processing. It’s the database behind the report that asks which category sold best in which month.
An analytics platform can’t live alone. It can scan years of history, but it isn’t built to confirm a customer’s order in a few milliseconds. The business still needs a database that records each sale correctly the moment it happens. That operational database is where the analytical data comes from in the first place.
What an OLTP Workload Looks Like
An OLTP workload is many small requests. A customer changes an address. A cashier adds a sale. Each request touches a handful of rows, found by a key, and should finish in milliseconds. Hundreds of people do this at once, so locks and transactions protect them from each other.
The tables are usually normalized. A customer’s address lives in one row, so one update fixes it everywhere. Storage tends to be row based: all the columns of a row sit together on a page. That’s perfect when you want the whole row. The data is current, such as today’s stock or this minute’s balance.
What an OLAP Workload Looks Like
An OLAP workload is a few large questions. How much did each category earn in the first quarter? The query reads millions of rows, but only two or three columns of each. Rows rarely change while it runs, though history can be corrected or deleted. Taking a few seconds is fine, because a person is waiting for an answer, not a receipt.
Storage here tends to be column based. All the values of one column sit together and compress well. The engine skips every column the question never names. The usual shape is a star schema. One wide fact table of events is surrounded by small dimension tables that describe them. It keeps history, so it mostly grows.
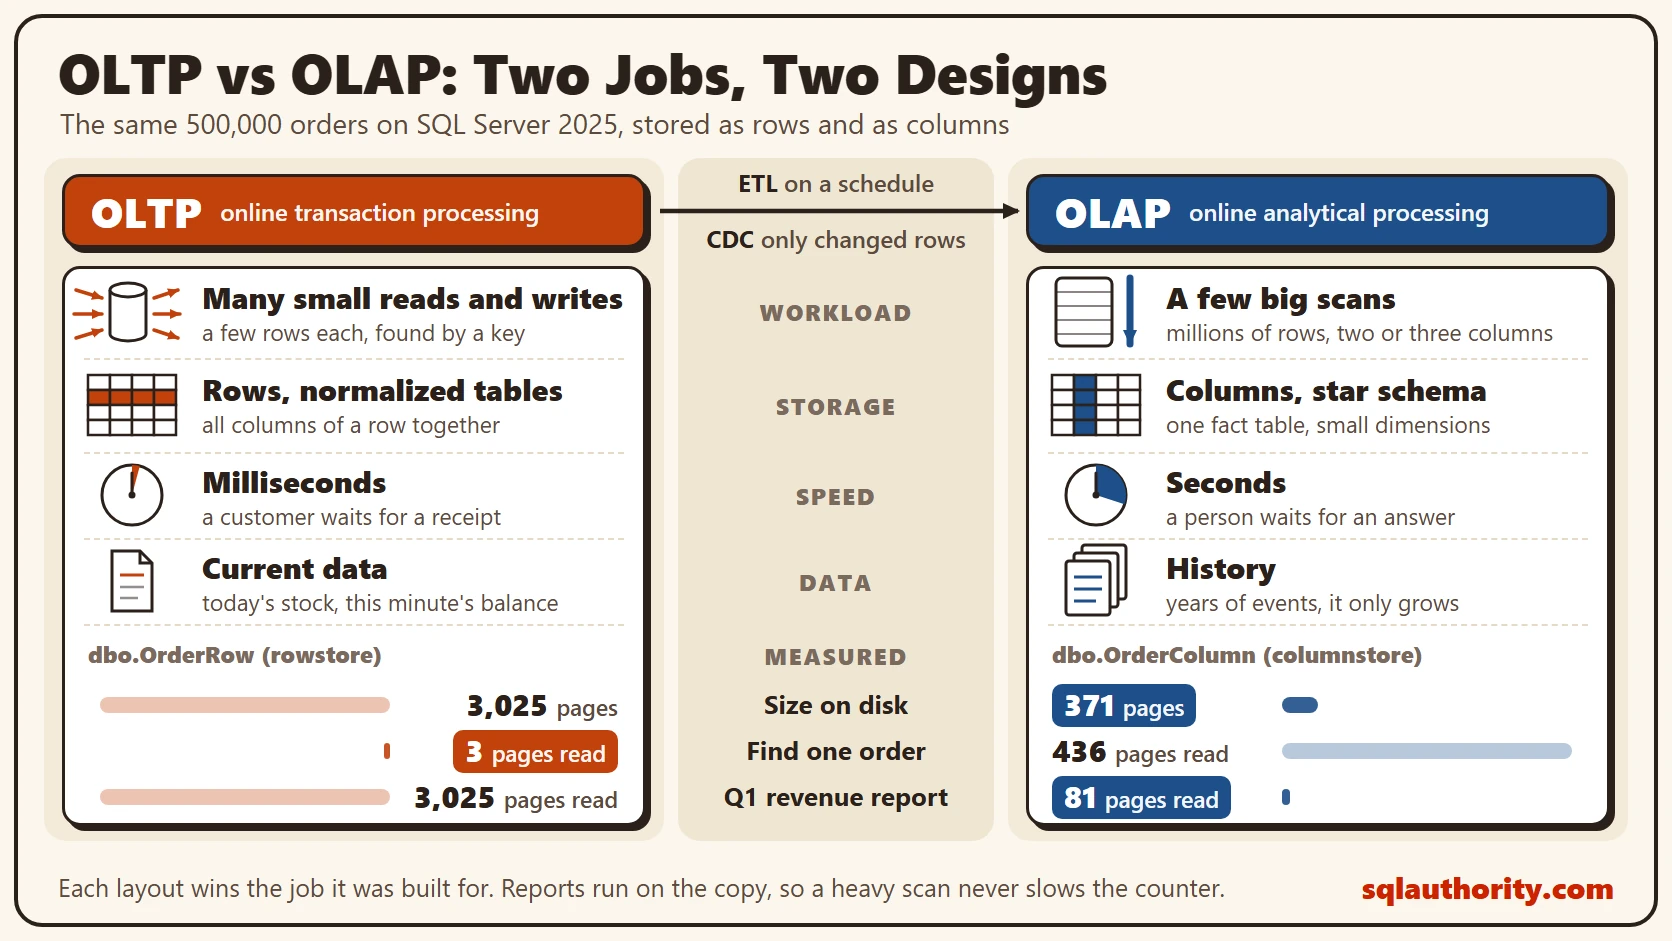
The diagram puts the two side by side. On the left, OLTP sends many small reads and writes. On the right, OLAP sends a few big scans. Below that, row storage with normalized tables faces columns with a star schema. Next comes speed, milliseconds against seconds, and then the age of the data, current against history. The arrow between the two is the copy that feeds the analytical side. We’ll get to it shortly.
Try It: One Table, Two Layouts
You can see the difference in SQL Server. This script creates a database called SqlBigDataOltpOlap, used only for this example, so run it on a test server. It builds an order table with 500,000 rows in the normal row layout, with a primary key on OrderID.
IF DB_ID(N'SqlBigDataOltpOlap') IS NULL CREATE DATABASE SqlBigDataOltpOlap;
GO
USE SqlBigDataOltpOlap;
GO
DROP TABLE IF EXISTS dbo.OrderRow;
DROP TABLE IF EXISTS dbo.OrderColumn;
CREATE TABLE dbo.OrderRow
(
    OrderID int NOT NULL PRIMARY KEY CLUSTERED,
    CustomerID int NOT NULL,
    Category nvarchar(20) NOT NULL,
    OrderDate date NOT NULL,
    Quantity int NOT NULL,
    Amount decimal(10,2) NOT NULL
);
INSERT INTO dbo.OrderRow (OrderID, CustomerID, Category, OrderDate, Quantity, Amount)
SELECT value, value % 5000 + 1, CHOOSE(value % 4 + 1, N'Bakery', N'Grocery', N'Juice', N'Books'),
       DATEADD(DAY, value % 365, '20260101'), value % 5 + 1, (value % 90 + 10) * 1.25
FROM GENERATE_SERIES(1, 500000);
The second table holds the same orders, stored as a clustered columnstore index. That’s SQL Server’s column based storage.
SELECT * INTO dbo.OrderColumn FROM dbo.OrderRow;
CREATE CLUSTERED COLUMNSTORE INDEX CCI_OrderColumn ON dbo.OrderColumn;
Compare their size first.
SELECT OBJECT_NAME(object_id) AS TableName, SUM(row_count) AS TotalRows, SUM(used_page_count) AS PagesUsed
FROM sys.dm_db_partition_stats
WHERE object_id IN (OBJECT_ID(N'dbo.OrderRow'), OBJECT_ID(N'dbo.OrderColumn')) AND index_id IN (0, 1)
GROUP BY object_id
ORDER BY TableName;
Both tables hold 500,000 rows. The row table uses 3,025 pages. The columnstore copy uses 371, about one eighth of that. Values in a column repeat a lot, so they compress well.
Now test one job from each side. The first query is an OLTP request: fetch one order by its number. The second is an OLAP request: revenue per category for the first quarter. STATISTICS IO reports how much data each query read.
SET STATISTICS IO ON;
SELECT OrderID, CustomerID, Amount FROM dbo.OrderRow WHERE OrderID = 123456;

SELECT OrderID, CustomerID, Amount FROM dbo.OrderColumn WHERE OrderID = 123456;

SELECT Category, COUNT(*) AS Orders, SUM(Amount) AS Revenue FROM dbo.OrderRow
WHERE OrderDate >= '20260101' AND OrderDate < '20260401' GROUP BY Category ORDER BY Category;

SELECT Category, COUNT(*) AS Orders, SUM(Amount) AS Revenue FROM dbo.OrderColumn
WHERE OrderDate >= '20260101' AND OrderDate < '20260401' GROUP BY Category ORDER BY Category;
SET STATISTICS IO OFF;
This is the text SSMS shows in the Messages tab, cut down to the read counts. It is output, not code to run.
Table 'OrderRow'. Scan count 0, logical reads 3, ... lob logical reads 0, ...
Table 'OrderColumn'. Scan count 1, logical reads 0, ... lob logical reads 436, ...
Table 'OrderRow'. Scan count 1, logical reads 3025, ... lob logical reads 0, ...
Table 'OrderColumn'. Scan count 1, logical reads 0, ... lob logical reads 81, ...
The lookup read 3 pages on the row table. On the columnstore table it read 436 large object pages. It had to find the order inside compressed column segments. The report reversed the result. The row table read 3,025 pages, which is the whole table. The columnstore table read 81.
| Category | Orders | Revenue |
|---|---|---|
| Bakery | 30,824 | 2,080,727.50 |
| Books | 30,824 | 2,119,147.50 |
| Grocery | 30,826 | 2,119,290.00 |
| Juice | 30,825 | 2,080,635.00 |
Both tables return these same four rows. Each layout tends to win at the job it was built for. That’s a small table, and on a larger one the gap grows.
The slow lookup has a standard fix. A nonclustered B-tree index on the columnstore table gives the lookup its own fast path. The INCLUDE list carries the two columns the query returns.
CREATE NONCLUSTERED INDEX IX_OrderColumn_OrderID ON dbo.OrderColumn (OrderID) INCLUDE (CustomerID, Amount);

SET STATISTICS IO ON;
SELECT OrderID, CustomerID, Amount FROM dbo.OrderColumn WHERE OrderID = 123456;
SET STATISTICS IO OFF;
The lookup now reads 3 pages, the same as the row table. The index is extra work on every write, which is the price of serving both jobs from one table.
How Data Moves From One Side to the Other
OLTP and OLAP don’t fight, because the data mostly flows one way. Transactions land in the OLTP database. A copy goes to the analytical store. ETL, short for extract, transform, load, runs a job on a schedule, such as every night. Change data capture, or CDC, reads the transaction log and sends only the rows that changed.
Reports then run on the copy. A heavy scan is far less likely to slow a customer at the counter. That holds while the copy has its own resources and a controlled load. The OLTP side isn’t always relational, either. Key-value and document stores serve transactions too. Key-Value and Document Databases: When Each One Fits explains when to pick them.
Is the Split Still Needed?
A fair objection is that the OLTP vs OLAP split is outdated. SQL Server can put a columnstore index on an OLTP table. Reports then run on live data, so why keep two copies? For modest reports, that works well. But that index is updated on every write, and the report still competes with transactions for CPU and memory. Once reports get large, a separate copy tends to cost less than slowing the counter.
What to Remember
In any OLTP vs OLAP decision, ask what the workload does before you pick a design. Many small requests that change current rows point to OLTP: row storage, keys and normalized tables. Few huge requests that read history point to OLAP: columns, a star schema and a copy of the data.
When I review a slow report, I check first whether it runs against the live transaction tables. If it does, a copy or a columnstore index is the first thing I try.
When you finish testing, remove the example database.
USE master;
GO
ALTER DATABASE SqlBigDataOltpOlap SET SINGLE_USER WITH ROLLBACK IMMEDIATE;
DROP DATABASE SqlBigDataOltpOlap;
OLTP vs OLAP is not a rivalry between two databases, it is a match between a workload and its design.
Published by Pinal Dave on SQLAuthority. More of my work at pinaldave.com.
Discover more from SQL Authority with Pinal Dave
Subscribe to get the latest posts sent to your email.



4 Comments. Leave new
HI, can i,plz ask you how can i establish the numbers of days in month by using sql?..thanks alot :)
Thanks Pinal .
Nice one pinal