
Business metrics alignment is where Business Intelligence helps most. Executive management and managers need the latest information to make intelligent decisions. More informed decisions mean more revenue, less risk, lower cost and better operational control, which gives a business agility.
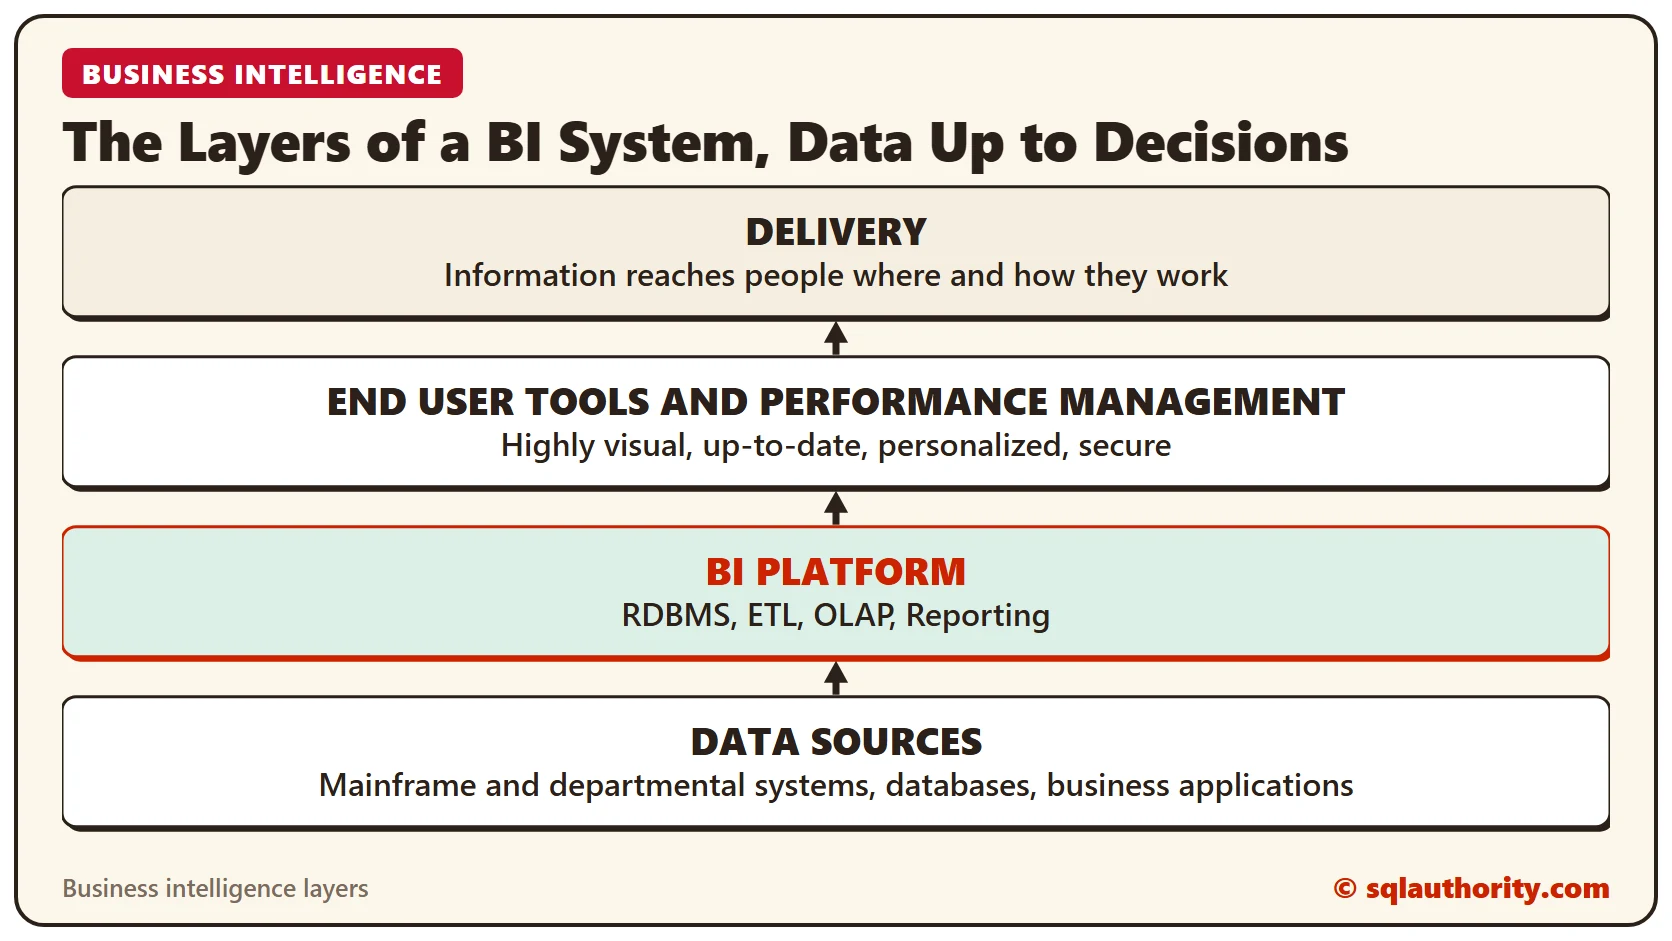
Organizations struggle with growing data volumes and complexity, and they struggle to use their own data efficiently. COOs, IT managers and business consultants ask for less information, delivered more easily, for smarter and faster decisions. They want information that is highly visual, up to date, personalized and secure. They also want it delivered where and how they work.
With Business Intelligence (BI), organizations can understand and analyze large volumes of rapidly changing data. BI helps decision makers use change as an advantage, reach corporate objectives and decide better and faster. BI is about improving decision making. When the latest information reaches the right people at the right time, decisions get better and arrive sooner.
Organizations now embed BI into their business processes to get a better workflow, on top of the other benefits. BI can make every area of a business strategic and value-rich.
The Layers of a BI System
Data flows up through the layers of the diagram. The data sources sit at the bottom, for example mainframe and departmental systems, databases and business applications. The BI platform above them handles RDBMS, ETL, OLAP and reporting. End user tools and performance management applications come next, and delivery reaches people where they work.
Proper BI Deployment: Aligning All Business Metrics
BI adds value to every department or business unit. Revenue-generating areas such as sales and product manufacturing are usually seen as critical to a company’s success. HR and operations are needed to do business, but they are not seen as crucial for revenue or business performance. So when BI value is discussed, the revenue-generating areas come to mind first. With the right metrics and data, that thought process needs to change.
Traditionally, BI focused on siloed information. Functional areas such as Finance, Sales, Marketing and HR created their own metrics. To add value from top to bottom, metrics must align across business units, and the silos must go.
HR, Finance and Sales still need their own specific metrics. Aligned with corporate objectives, the metrics of every area become a potent tool for the top and bottom line. Line leaders, middle managers and executives all need metrics and dashboards that agree with and support one another.
Businesses today work hard to make smart decisions that help them run a strategic operation and gain a competitive advantage. One key aspect of proper BI deployment is aligning the metrics from top to bottom across functional areas. That goes a long way toward business success.

Scenario: Business Intelligence in the Real World
Let us take a real-world scenario. It shows how aligned business metrics make every area of a business more strategic. Our example company is a car manufacturer, Speed Motor Manufacturing. Its top corporate objective is to increase its profit margin by 5%. To reach it, every area of the business needs to help the bottom line, including HR. Most organizations consider HR important, but not strategic and not a contributor to the bottom line.
Now assume that operations decides its best contribution is to use a new type of machine 20% more. The machine speeds up the assembly of car components. Manufacturing gets faster, and more cars are produced per day. But not everyone can operate this complex machine. It needs specialized training and more experienced users. To meet the objective, the machine needs 20% more usage for the year.
Here HR can play a major role. HR ties its goals and metrics to those of operations. That contributes directly to the corporate objective of a 5% higher profit margin. HR must retain the skills needed to run these machines. It must also train people to operate them and hire new skills where needed. HR’s metrics map to the metrics of the operations team, and those map to the overall corporate metrics. This is how metrics align top to bottom and across the organization.
To measure these metrics and build dashboards, the data and the data structure must be available and appropriate. With the data structure in place and the objectives aligned, every area of an organization can be strategic. Each one then contributes to better business performance.
In our example, HR measures the training it ran, which increased the number of qualified machine operators. The operations leader measures the hours the new machine ran compared to the previous year. The finance team measures the profitability of operations this year compared to last year and quantifies the increase in margin. All the departments work toward one objective, set up metrics to measure their success and link them to each other.
In short, proper deployment of Business Intelligence makes room for objective alignment and a clearer vision across the organization. That means business success and a competitive advantage.
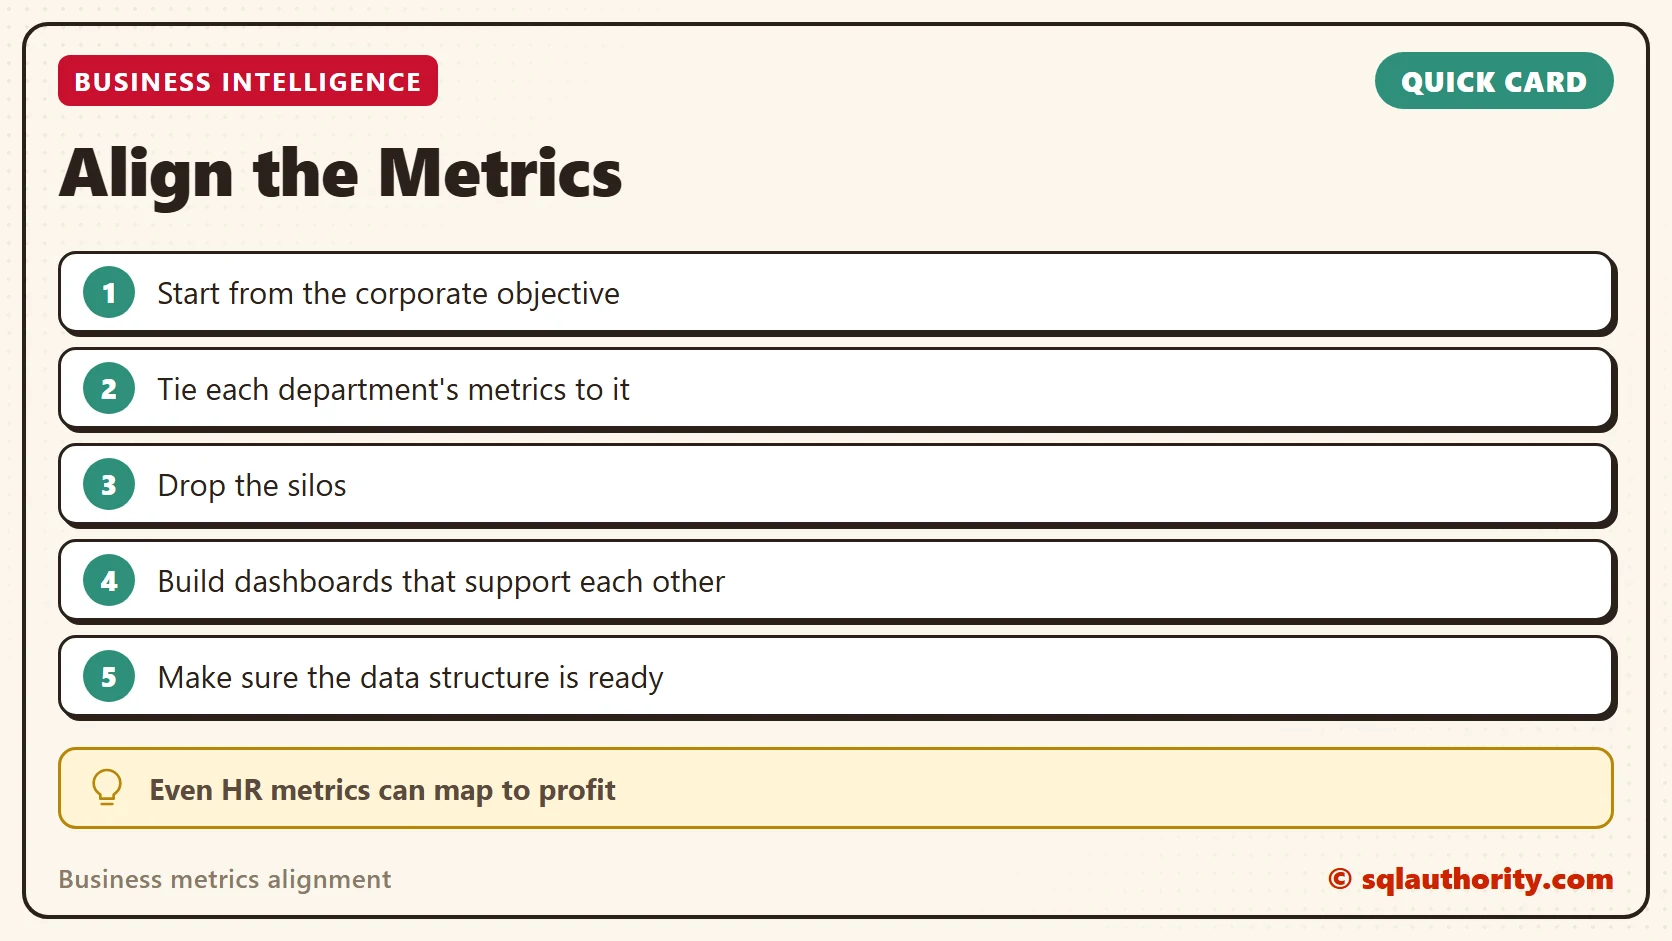
A metric is not a department’s property, it is a link in the chain to the corporate objective.
Published by Pinal Dave on SQLAuthority. More of my work at pinaldave.com.
Discover more from SQL Authority with Pinal Dave
Subscribe to get the latest posts sent to your email.



6 Comments. Leave new
Hi Mr.Pinal,
Fundoo article and fundoo explanation of BI…gr8….
One word i didn’t get is – SILOS,SILOED…
What is the meaning??
Thanks,
Nitin Sharma
Hi Nitin,
Let us say a dept/group is working in a silo, it means that they are in their own world without any interactions with other groups, also means lack of integration. In BI perspective we hear this a lot, for example: finance is in its own silo or IT is in its own silo. For BI to be effective all the units should work together.
Thanks Ramdas.
I got it…..It means “ISOLATION”…
really very excellent description. :) why don’t you start BIAuthority.com
Hi Pinal,
I like the venn diagram you put up with the different units and how BI is the intersection of them. This is what we constantly stirve to achieve in the BI world.
Thank you
great!